


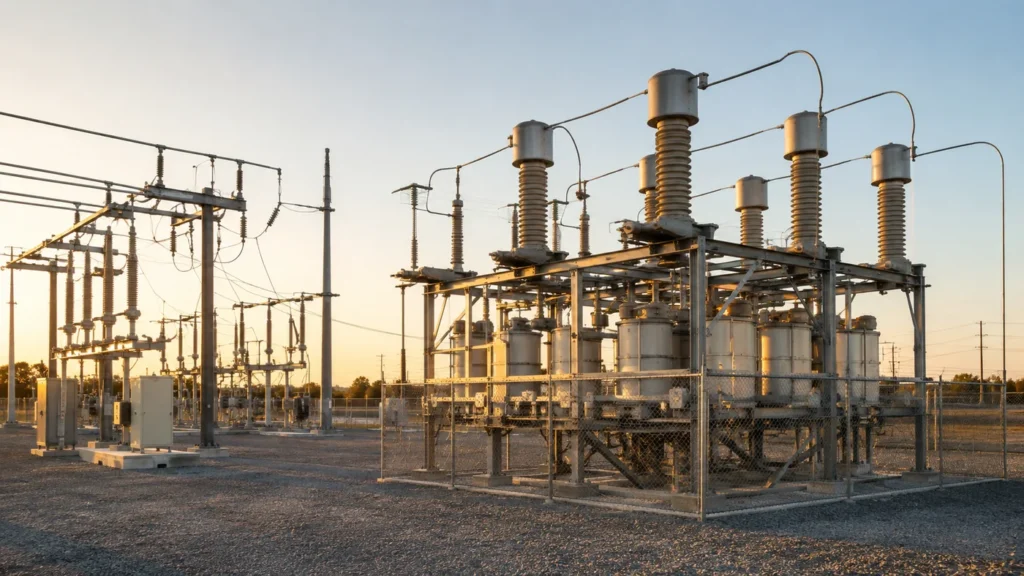
Substation capacitor bank sizing starts with the reactive-power and voltage objective, then uses time-series measurements and load-flow studies to select location, total Mvar, and step size. The familiar power-factor equation can provide an initial kvar estimate, but it cannot prove acceptable bus voltage, minimum-load behavior, switching transients, harmonic resonance, failed-unit voltage, or protection coordination. Final sizing must cover peak, minimum, contingency, and generation cases using the actual network and owner criteria.

Define the Sizing Objective First
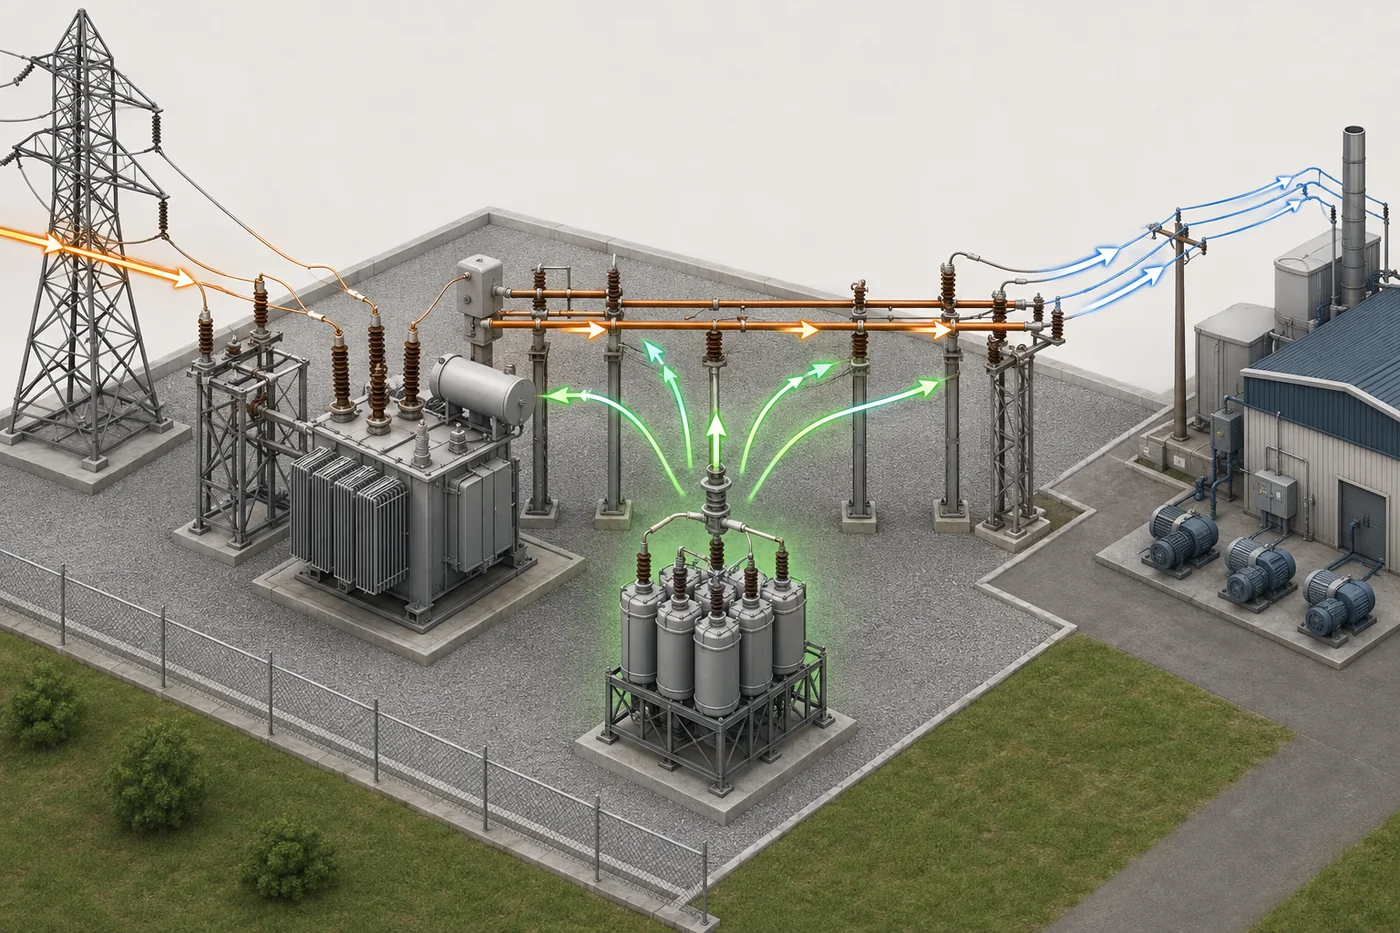
A substation bank may be intended to hold bus voltage during peak demand, reduce reactive import through a transformer, release MVA capacity, reduce feeder current and losses, meet a point-of-interconnection power-factor requirement, or support a contingency. These objectives can produce different locations and step sizes. State the controlled bus, target range, limiting operating case, and success metric before calculating kvar. A plant power-factor formula can estimate total reactive demand, but utility selection must also prove acceptable voltage, switching, protection, and harmonic behavior across the network.
Collect Time-Aligned System Data
Use interval real power, reactive power, voltage, current, transformer taps, regulator operations, existing capacitor status, and major load or generation states. Cover peak and minimum load, seasons, weekdays, motor starting, feeder transfers, maintenance configurations, and credible contingencies. Include distributed solar, storage, and inverter controls because real-power direction and reactive demand may not follow the old daily pattern. Validate CT and VT ratios, sign conventions, and missing data. A clean one-day snapshot is not enough when a bank will operate for years.
Estimate Reactive-Power Requirement
For a steady load, a screening estimate for power-factor correction is Qc = P × (tan φ1 − tan φ2), where P is real power, φ1 is the present displacement angle, and φ2 is the target angle. Use consistent kW and kvar units. This estimate says how much reactive demand would change at the measurement point; it does not determine the best bus, number of steps, or switching duty. For a utility bank, run the estimate at several load levels and compare it with modelled reactive exchange and voltage constraints.
Use Load Flow for Final Location and Rating
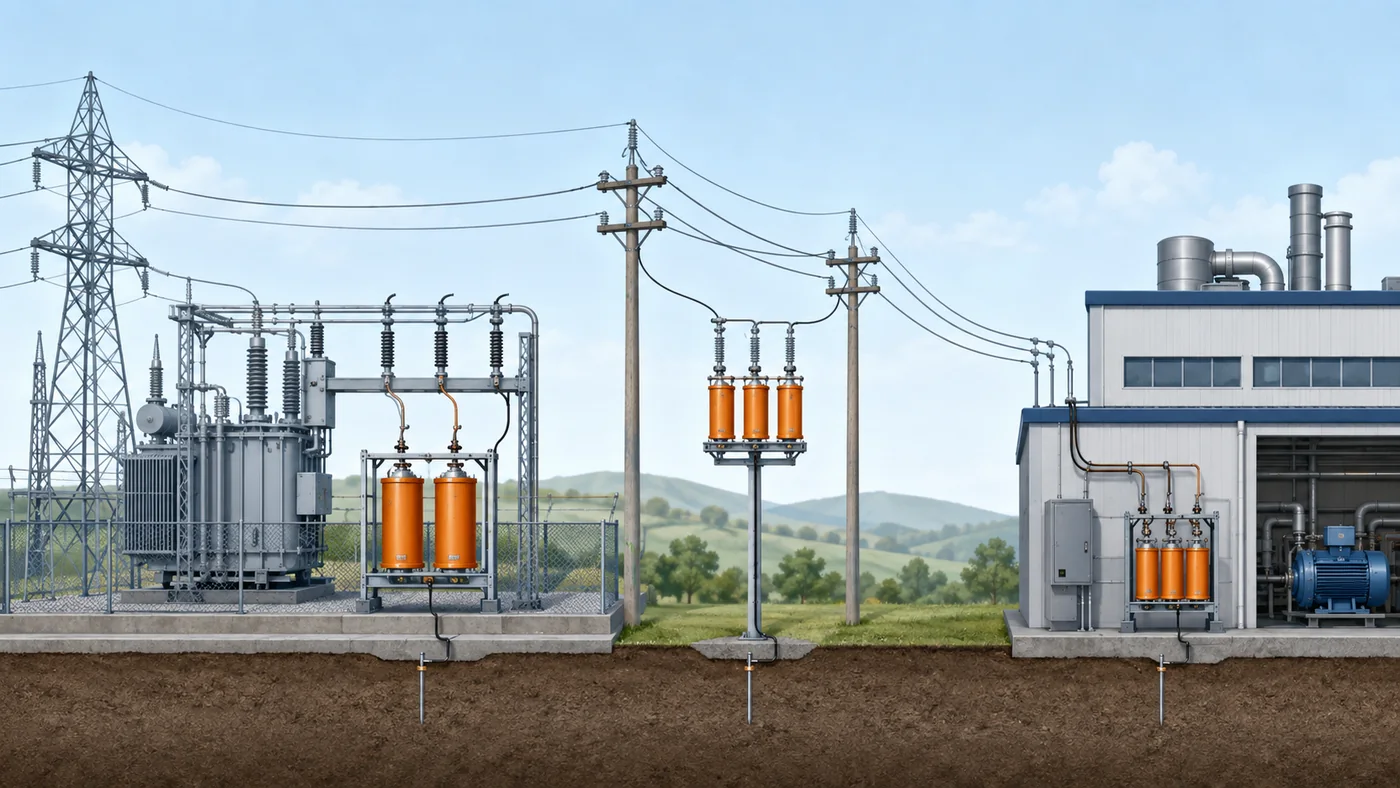
Build or update a network model with source strength, transformer impedance and tap control, bus arrangement, feeder impedances, load composition, generation, regulators, existing banks, and planned configurations. Test candidate banks at the substation bus, feeder head, and relevant downstream points. For every case compare node voltage, transformer and conductor loading, losses, reactive exchange, power factor, and control actions. An unbalanced distribution system may require phase-domain analysis. The selected kvar is the smallest coordinated solution that meets the stated objectives across required cases with acceptable margin.

Screen the Voltage Step
A simple screening relationship is ΔV per unit approximately equal to Qstep divided by short-circuit MVA at the bus when assumptions are suitable. It illustrates why the same kvar step produces a larger voltage change on a weak bus than on a strong bus. It is not a universal design equation: resistance, network topology, transformer taps, load response, other controls, and unbalance affect the result. Use it only to reject obviously oversized steps or establish an initial range, then confirm switching voltage change with the full study and owner criteria.
Choose Total kVAR and Step Size Separately
Total bank rating addresses the maximum required reactive support. Step size controls resolution, voltage change, switching frequency, and light-load behavior. One large step may be simple but create an excessive voltage jump or leading condition. Many small steps improve control resolution but add breakers, switches, relays, cost, and maintenance. Review the minimum reactive demand that can absorb one step, the maximum acceptable bus-voltage change, switching-device endurance, controller delay and deadband, and the sequence used when multiple banks share a bus.
| قرار | الأدلة الأولية | Failure if ignored |
|---|---|---|
| Total Mvar | Peak reactive and voltage cases | Insufficient support or overcompensation |
| Step size | Voltage change and minimum load | Large jumps or control hunting |
| الموقع | Node voltage, current, and loss results | Reactive current remains upstream |
| تحكم | Time series and device coordination | Unnecessary switching and tap operations |
Check Transformer and Feeder Capacity
Reducing reactive current can lower transformer and feeder current for the same real-power transfer, but the released capacity must be calculated from the actual MVA and thermal limits. Do not claim that every kvar installed becomes equal new kW capacity. Verify transformer loading, conductor ampacity, voltage drop, protection sensitivity, and the load profile after compensation. If the real-power load already reaches a thermal or voltage constraint for another reason, capacitors may provide limited relief. Document which constraint improves and which remains unchanged.
Prevent Light-Load Overcompensation
Run minimum-load and high-generation cases with each credible bank state. Excess capacitance can create leading reactive export, high voltage, unnecessary tap changes, and increased harmonic risk. Fixed banks should be smaller than the persistent reactive requirement with suitable margin. Switched banks need reliable sensing and a defined fail-safe state. Coordinate voltage, kvar, current, time, temperature, and supervisory controls. Check loss of communication and stuck-switch scenarios. Where daytime solar raises voltage, a traditional time schedule based on historical load may be unsuitable.
Study Switching Transients
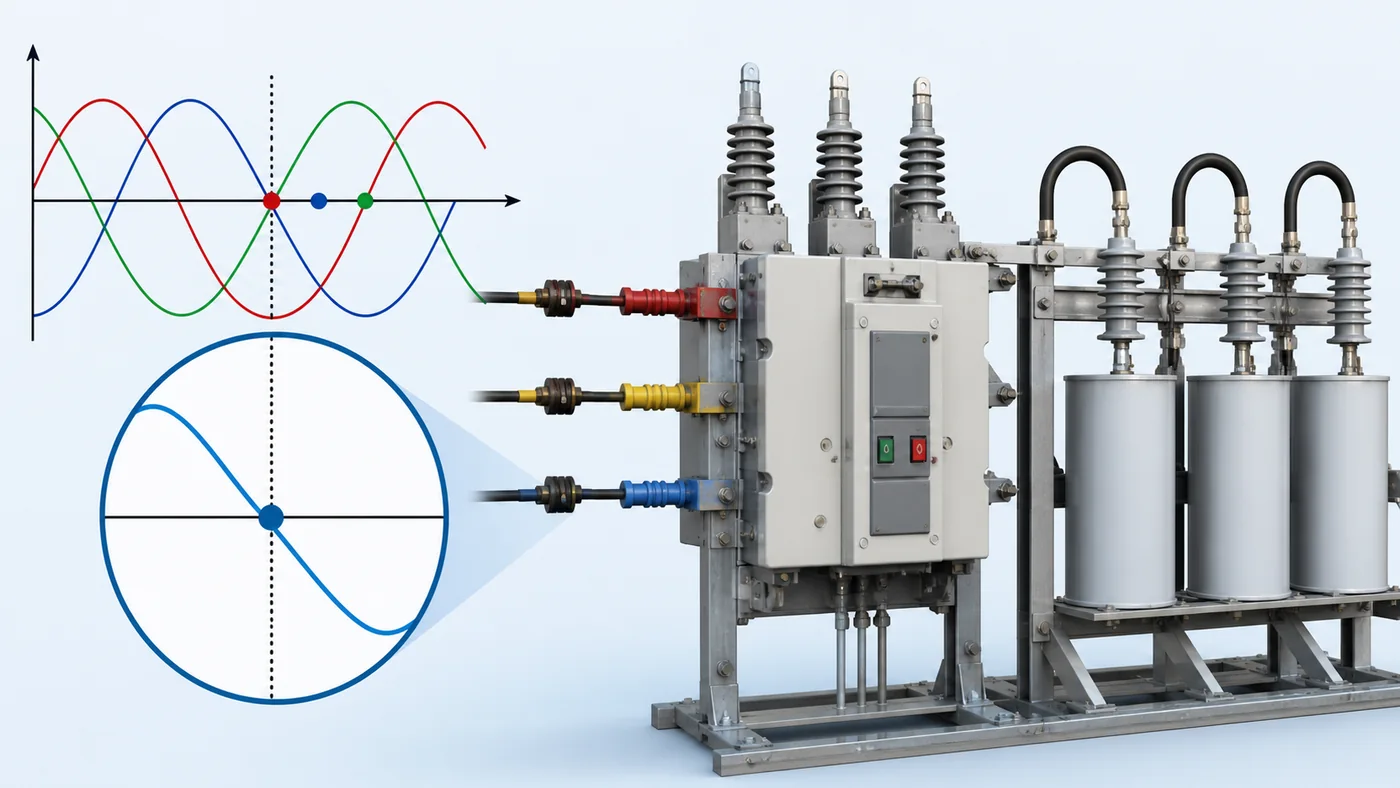
Calculate or simulate energization inrush, back-to-back duty, discharge and trapped charge, breaker or switch capability, restrike risk, surge-arrester duty, and the voltage step seen by customers. The bank rating does not by itself define these stresses. Existing parallel banks and connecting-bus inductance can dominate high-frequency current. Point-on-wave control, pre-insertion devices, or reactors may be justified, but each has application limits. Verify the maximum operating count and minimum reclose delay so the control strategy stays inside electrical and mechanical endurance.
Run a Harmonic and Resonance Check
Capacitors change network impedance and can move a parallel-resonance frequency toward a characteristic harmonic. Use measured harmonic currents and voltages plus a frequency scan for relevant network configurations. Check capacitor RMS current and voltage, unit and fuse duty, reactor heating, bus distortion, and changes when banks or transformers are switched. A bank that meets the 50/60 Hz kvar objective can still be unacceptable at harmonic frequencies. Detuned reactors, filters, or dynamic reactive equipment may be required where a plain shunt bank would amplify distortion.
Protection and Failed-Unit Margin
Select the bank connection and fusing architecture, then calculate healthy inherent unbalance and the signal caused by progressive element or unit failures. Determine surviving-unit voltage, alarm level, trip level, and any permitted temporary operating condition. Coordinate phase, ground, unbalance, voltage, breaker-failure, and switching logic with upstream devices. The number of series and parallel units affects both protection sensitivity and fault duty. Final rating must include insulation, ambient, altitude, contamination, tolerance, and applicable owner or regulatory requirements.
Worked Screening Example
Assume a substation supplies 8 MW at 0.82 lagging displacement power factor and the planning target is 0.95. The screening formula gives φ1 = arccos(0.82), φ2 = arccos(0.95), and Qc approximately 8 × (0.698 − 0.329) = 2.95 Mvar. That is an initial total requirement, not a purchase rating. Engineers might study several stepped alternatives around this range, then reject options that cause excessive minimum-load voltage, unacceptable switching steps, resonance, or control interaction. The final bank can be smaller, larger, relocated, or divided after load-flow and contingency results.
RFQ Inputs and Acceptance Evidence
Provide system voltage and frequency, target bus, load and generation profiles, existing compensation, transformer and feeder data, source short-circuit levels, total kvar and proposed steps, connection, grounding, switching frequency, parallel-bank conditions, harmonic measurements, environmental ratings, protection philosophy, communications, standards, and required studies. Require drawings, loss data, unit arrangement, fuse coordination, unbalance calculations, switching-duty evidence, discharge provisions, settings recommendations, factory tests, and commissioning support. Acceptance should compare measured voltage, kvar change, current, unbalance baseline, and switching records with the approved study.
Document the Selected Margin
State which uncertainties the design margin covers: forecast growth, measurement error, capacitor tolerance, unavailable units, transformer configuration, or future generation. Do not hide all uncertainty inside one oversized kvar value. An oversized bank can create new voltage and switching problems. Keep the rejected alternatives and limiting cases with the approved report so future expansion teams can see when another step is justified and when the original assumptions have expired. Re-run the study after material network, load, generation, or control changes.
Related Guides
استخدم plant power-factor sizing guide for LV calculations, and review substation bank purpose, feeder placement, bank protection, و plant compensation products.
أسئلة متكررة
Can I size a substation bank from power factor alone?
No. It is an initial reactive estimate; final selection needs network, voltage, switching, harmonic, and protection studies.
How many steps should the bank have?
Enough to meet control resolution and voltage-step limits without excessive equipment or switching operations.
Why check minimum load?
A bank suitable at peak load can cause leading vars and excessive voltage when load falls.
Does a weak bus need a smaller step?
Often the same kvar produces a larger voltage change on a weaker bus, but the system model must confirm it.
Is the worked example a final design?
No. It demonstrates screening math only and must not replace a project study.
المراجع
