


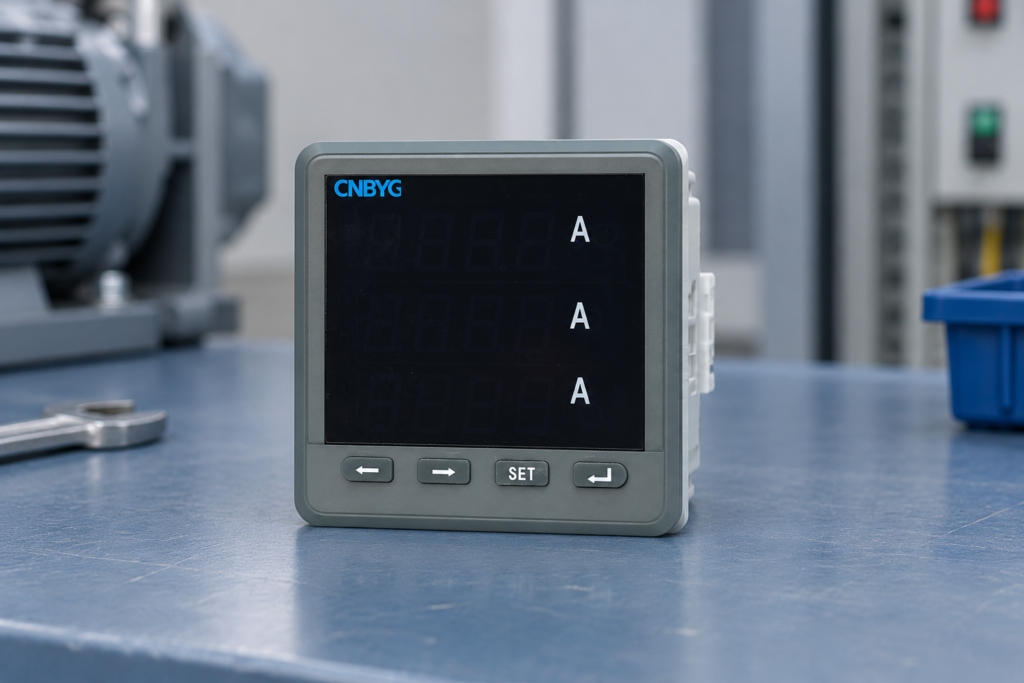
A power quality survey should connect measured electrical conditions with the plant’s actual operating states and the decision the survey must support. Start with a defined problem, select measurement boundaries and suitable instruments, record representative production conditions, and interpret the results before specifying corrective equipment. A collection of screenshots without locations, settings or operating context is not a dependable survey.
For an industrial plant, the investigation may address nuisance trips, capacitor stress, harmonic current, voltage events, poor power factor or a planned equipment upgrade. These objectives need different evidence. The procedure below helps an engineering team build a repeatable investigation without assuming that every disturbance requires a filter or a larger capacitor bank.
Define the question and acceptance criteria
Write a short survey brief: what happened, where, when, and which decision must follow. Examples include establishing whether a new VFD group changes harmonic loading, investigating trips during a production start, or preparing a reactive-power compensation inquiry. Avoid an objective as vague as “check all power quality.”
Identify the relevant electrical boundary. A utility agreement may concern the point of common coupling, while a machine fault may require measurements at its supply terminals. Do not apply a limit at one boundary to a reading from another without a documented basis. Record which contractual or technical requirements govern the assessment.
The IEC 61000-4-30 publication addresses power-quality measurement methods. Measurement methodology and acceptance limits are separate subjects: citing the measurement standard does not by itself establish that a plant passes a utility requirement. Use the edition and requirements applicable to the project.
Gather the plant information
Collect a current single-line diagram, transformer and source data, major load list, capacitor-bank configuration and recent fault records. Include generator operation, solar generation or storage if they affect the electrical boundary. Ask production staff which processes create the largest starts, stops or repeated cycles.
Review existing monitoring before installing temporary instruments. It may reveal event times or broad load patterns, although its measurement capabilities need verification. The CNBYG BY194 multifunction power instrument is relevant to panel measurement; confirm the exact model functions rather than assuming it provides every harmonic, transient or standardized power-quality capability.
Identify gaps in the information. An outdated drawing, unknown CT ratio or missing event timestamp can prevent a useful comparison later. Resolve these issues early or record them as limitations. A survey report should not quietly turn missing input data into apparently precise conclusions.
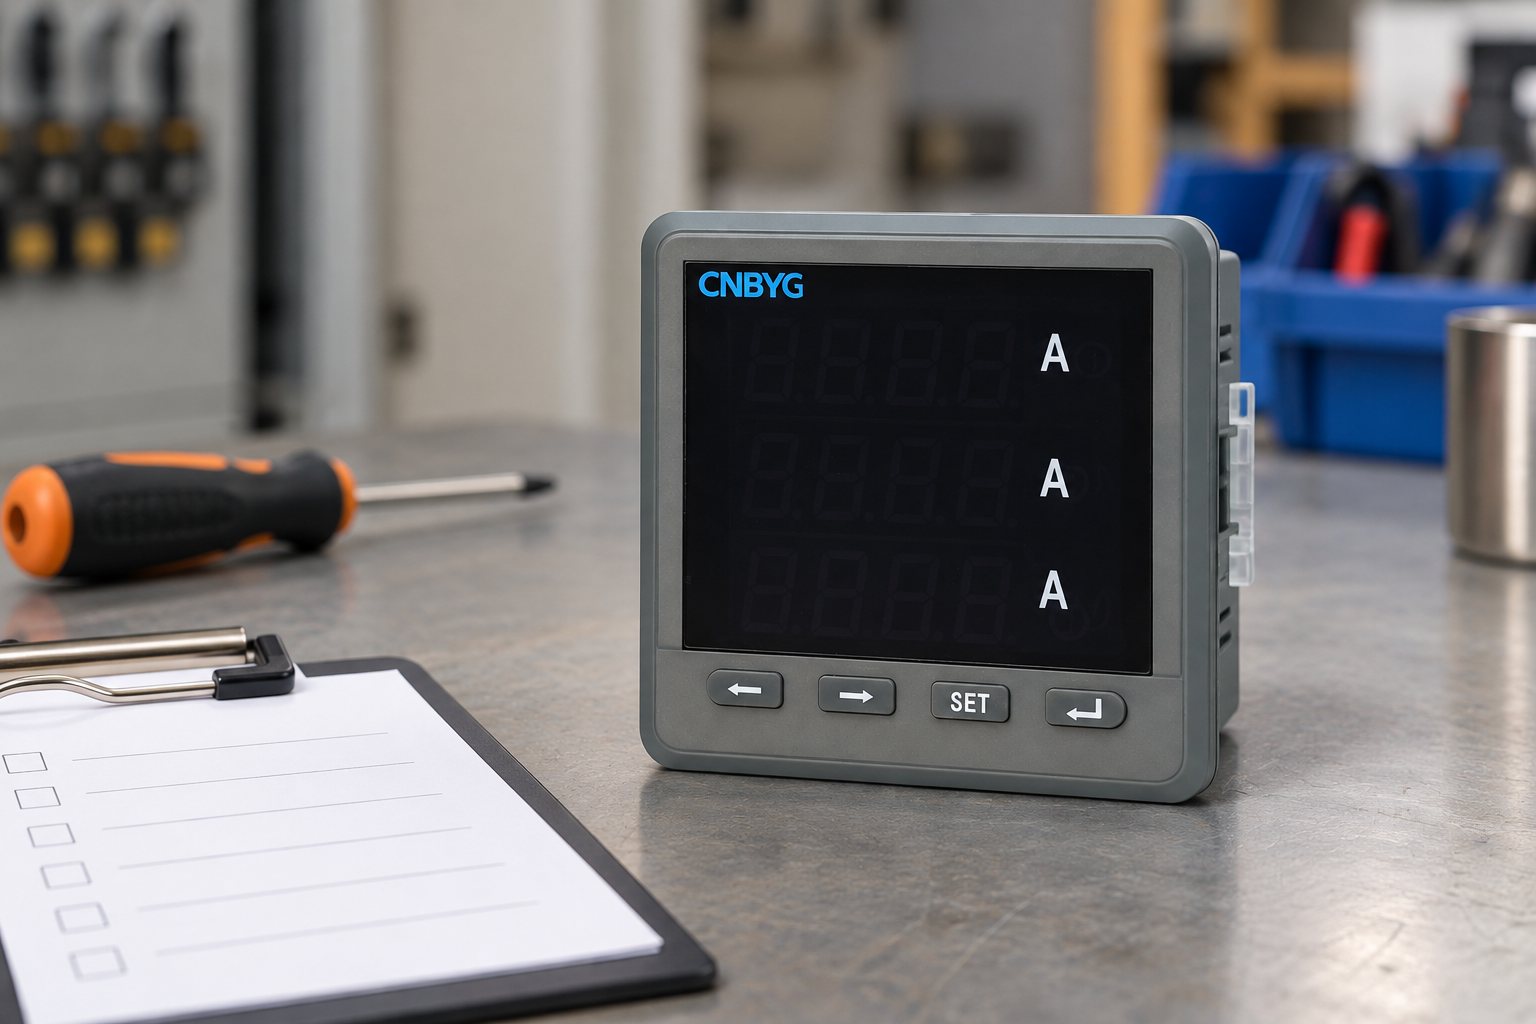

Reference-based illustration of a panel instrument. It does not claim that this model performs every survey function.
Select measurement points by purpose
Start at the boundary that answers the main question, then add downstream points only where they help distinguish sources or effects. Simultaneous upstream and downstream measurements can be valuable for a time-sensitive event. Sequential measurements may be enough for a steady operating comparison, but cannot prove that separate events had the same cause.
| Survey objective | Useful measurement boundary | Operating context to record |
|---|---|---|
| Utility-side harmonic assessment | Agreed common-coupling boundary | Source configuration and representative loading |
| Repeated machine trips | Machine supply and a related upstream point | Trip times, starts and process state |
| Capacitor-bank stress | Bank circuit and its supplying bus | Stage commands, reactor arrangement and load state |
| Compensation equipment inquiry | Proposed sensing and connection boundary | Load range, reactive demand and harmonic profile |
| Upgrade comparison | Consistent before-and-after boundary | Same process modes and meaningful load conditions |
The table gives qualitative planning guidance. Measurement access, connection method and suitability of each point require a site-specific engineering and safety assessment. More meters are useful only when their additional evidence answers a defined question.
Match the instrument to the evidence needed
Specify the required parameters before choosing equipment. Long-term RMS trends, harmonic spectra, waveform event capture and fast transient recording are different capabilities. A meter displaying current and power factor does not automatically capture a short voltage event, and a spectrum screenshot does not demonstrate long-term compliance.
Check instrument documentation, measurement class where relevant, channels, sensor range, bandwidth, memory and export format. Include the measurement chain: sensors, scaling, installation and clock synchronization affect the result. A high-quality analyzer connected to the wrong CT ratio still produces incorrect engineering values.
For harmonic measurements, the IEC 61000-4-7 publication provides authoritative context on instrumentation and spectral measurement. Consult the applicable full documents and project specification for detailed methods. Do not invent a harmonic limit from the title of a measurement standard.
Plan safe installation and removal
Qualified personnel must assess access, circuit ratings, isolation arrangements and the approved connection procedure. Do not turn a survey into an improvised live-panel experiment. The OSHA electrical work-practice requirements address de-energization and electrical work practices; local requirements and the actual installation govern the work.
Record the instrument location and sensor identity so they can be verified without ambiguity. Label channels consistently with the drawing, check CT or probe direction, and document voltage-current phase association. The installation record should allow another engineer to reconstruct the measurement boundary accurately.
Plan removal as carefully as installation. Temporary leads and sensors must not become undocumented permanent equipment. Include responsibilities, the authorized work window and confirmation that the cabinet is restored after the survey. Save configuration and data before removing instruments.
Check data quality before leaving the site
Verify plausible values, phase association, scaling, direction and clock settings at the beginning of the recording. Compare with a suitable reference where the procedure requires it. A quick first review can identify a disconnected channel or wrong ratio before several days of unusable data accumulate.
Confirm trigger settings and storage behavior against the objective. Extremely sensitive triggers can fill memory with unhelpful events, while thresholds chosen too broadly can miss the symptom. Record the configured values and why they were selected. Configuration changes during the survey should be time-stamped in the log.
Check that exported files can be opened and interpreted. Do not wait until after instrument removal to discover that the software exports only images or that timestamps lack a usable time zone. Raw data, configuration and event records are usually more useful than a report containing only selected charts.
Cover representative operating states
The survey needs to include the states that can explain the problem: full production, reduced load, large starts, process changeovers, bank switching and alternative supply modes where relevant. A long record of one quiet shift may be less useful than a shorter record that captures the actual trigger.
Coordinate with production staff to maintain an operating log. Use real timestamps and machine identities. Do not create test conditions that the plant cannot safely or normally experience merely to obtain dramatic waveforms. Where the target event does not occur, report that limitation and define what further observation is needed.
Review the event-triggered harmonic logging guide for intermittent loads and the power-quality metering guide before an APF/SVG inquiry for procurement-focused evidence. These topics complement the survey procedure rather than replacing the site’s investigation brief.
Interpret findings without jumping to equipment
Separate voltage disturbances, current distortion, reactive-power demand and measurement errors. Their remedies can differ. A voltage event seen across multiple feeders may require a different investigation from a harmonic current concentrated on one process circuit. Correlation helps narrow the question but is not automatically proof of cause.
For each finding, state the location, period, operating condition, measured quantity and supporting record. Distinguish persistent conditions from occasional events and describe uncertainty. Avoid using one maximum screenshot to characterize the entire plant when the distribution and duration tell a different story.
Before recommending correction, establish the mechanism and the design boundary. An APF, SVG, reactor-equipped capacitor bank or installation repair may each be relevant in a suitable case. Equipment should be selected from verified requirements, not because its product category matches a broad symptom description.
Reference-based illustration. The survey report must use real measurements and operating records.
Deliver a report that supports action
Include the brief, diagram, measurement points, instrument and sensor details, settings, operating coverage, data-quality checks, findings and limitations. Link each proposed action to evidence. Identify who must approve a design change and what follow-up measurement will show whether it worked.
The power-quality system overview provides system context. A practical survey handover should also preserve raw files and configuration so future teams can compare the same boundary after production changes or corrective work.
Further learning

Watch Power Quality: Standards and Monitoring
For a complementary engineering check, see selecting power quality meter locations.
For a complementary engineering check, see reading a power quality harmonic spectrum; distinguishing voltage sag from voltage dip; investigating voltage swell causes and mitigation.
For a complementary engineering check, see planning transient voltage monitoring; comparing Class A and Class S instruments; understanding IEC 61000-4-30 methods.
For a complementary engineering check, see measuring neutral current in a three-phase four-wire system; selecting CTs for a multifunction power meter.
For a complementary engineering check, see investigating shopping mall power quality.
For a complementary engineering check, see surveying commercial building power quality; investigating VRF HVAC harmonics; assessing LED lighting harmonics.
For a complementary engineering check, see assessing water pumping station harmonics.
For a complementary engineering check, see assessing microgrid power quality.
Frequently asked questions
Is a single harmonic screenshot a complete survey?
No. It needs measurement location, method, operating context and a representative recording period. A screenshot can illustrate a finding but does not establish the whole operating profile.
Can a standard panel meter replace a specialist analyzer?
Only when its confirmed capabilities meet the defined objective. Check the exact model functions, recording and measurement method instead of assuming all instruments are interchangeable.
How many points should be measured?
Enough to answer the investigation question and distinguish relevant boundaries. Additional points should have a specific purpose; simultaneous recording may be necessary for event attribution.
What if the suspected event never happens?
Report the coverage and absence of the event honestly. Preserve useful baseline findings, explain the remaining uncertainty and plan observation around the actual operating trigger.