


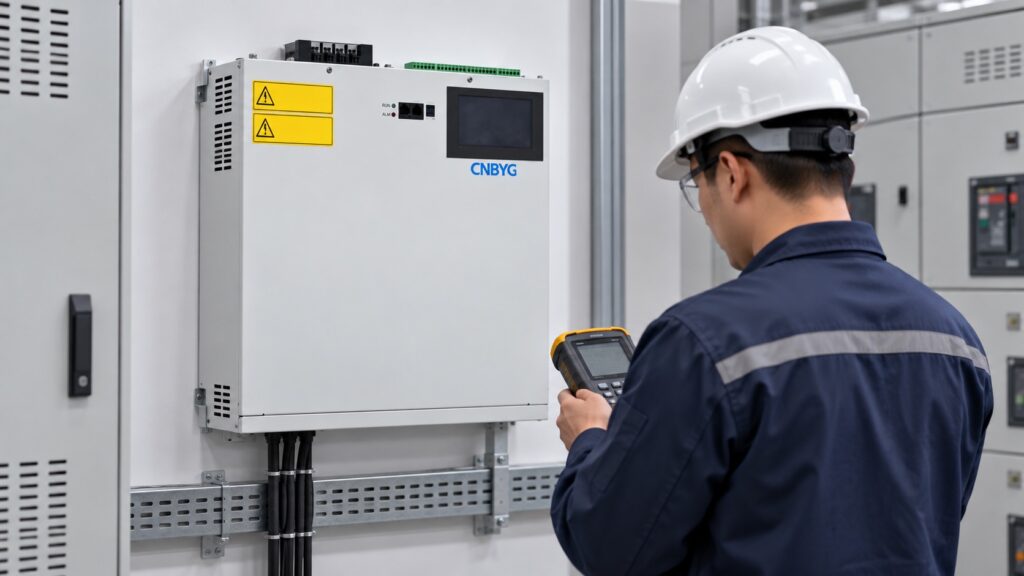
Como a tensão da grade afeta a capacidade de saída do SVG
Grid voltage affects the usable output capacity of a static var generator because the SVG creates compensating current through the connected voltage waveform. The nameplate kvar or ampere value is therefore not a promise that the same reactive power is available at every voltage, temperature and operating condition. A sound selection starts with the actual line-to-line voltage range, the required reactive current, the compensation point and the equipment’s approved capability curve.
The practical question is not simply whether the supply is “high” or “low.” The engineer must ask what the SVG measures, what current it can produce, which protection limits apply, and whether the upstream transformer, feeder and cabinet can tolerate the changed current. The Página do produto CNBYG SVG provides the product context; the final rating must be checked against the selected model documentation and site measurements.
What output capacity means in an SVG
An SVG is a current-controlled power-electronic device. It senses the three-phase system, calculates the required compensating component and injects a controlled current so that the source sees a better reactive-current balance. In simplified terms, reactive power is related to voltage and current:
[Q \approx \sqrt{3} \times V_{LL} \times I_Q]
where (V_{LL}) is line-to-line voltage and (I_Q) is the reactive component of line current. If the current limit is fixed, available kvar changes with voltage. If the required kvar is fixed while voltage falls, the required current rises. That is why a unit that appears adequate at nominal voltage may approach its current limit during a sustained undervoltage event.
The same reasoning applies to harmonic or unbalance functions when they share the converter’s current budget. The display may show a nominal capacity, but the control system still has to divide its available current between the enabled objectives. Do not interpret a capacity label as independent capacity for every mode at the same time.
Voltage and capacity relationship
The table below is a design guide, not a substitute for the model capability curve. Use it to decide which measurements and supplier confirmations are needed.
| Condition | What changes electrically | What to verify |
|---|---|---|
| Nominal voltage | Current and kvar are close to the rated operating point. | Rated current, duty cycle, ambient and enabled functions. |
| Sustained undervoltage | The same kvar requires more current; current limiting may reduce output. | Lowest measured voltage, protection thresholds and capability curve. |
| Sustained overvoltage | For a fixed current, theoretical kvar increases, but insulation, thermal and control limits still apply. | Voltage tolerance, derating rules and alarm history. |
| Voltage unbalance | Negative-sequence conditions add stress and can change the measured requirement. | Phase-by-phase voltage, unbalance calculation and trip settings. |
| Distorted voltage | The converter and measurement algorithm operate on a non-ideal waveform. | THD, dominant orders, synchronization and interaction with other equipment. |
| Rapid voltage variation | The target current changes quickly and may be limited by control or protection response. | Event traces, ride-through settings and plant disturbance records. |
Establish the real voltage boundary
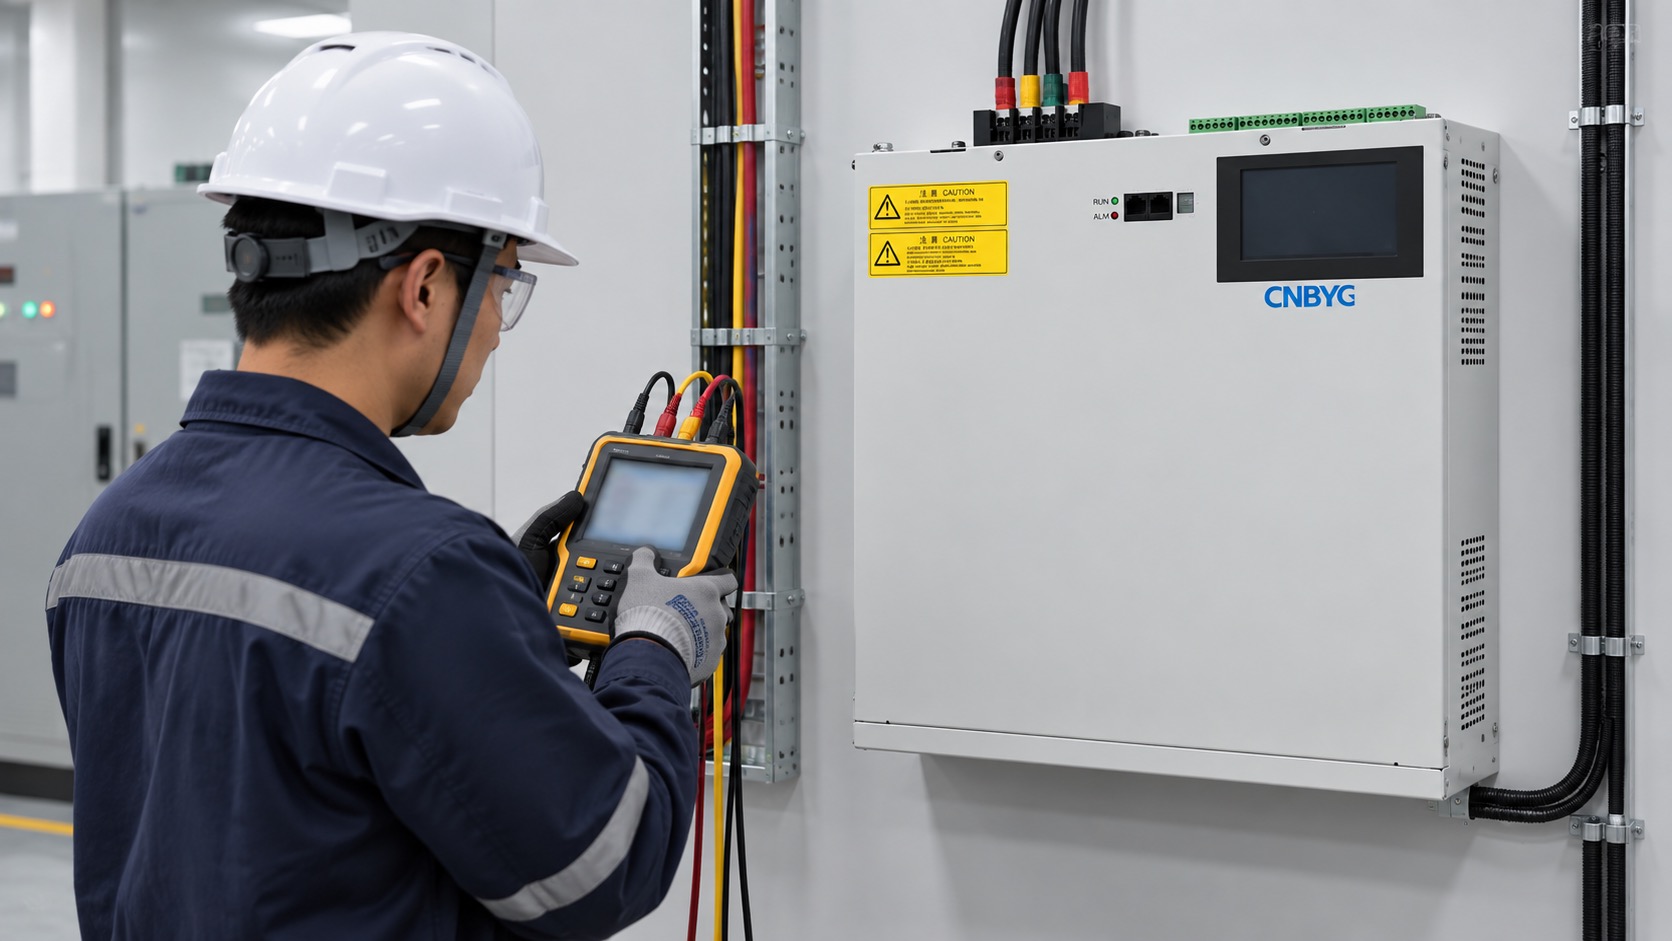
Measure voltage at the same electrical point used for the control objective. A utility meter at the incomer, a switchboard analyzer and the SVG’s internal value may legitimately differ because of transformer impedance, cable drop, CT/VT location and sampling. The commissioning procedure should identify which value is authoritative for acceptance.
Collect a time series rather than one handheld reading. Record line-to-line voltage, line-to-neutral voltage where applicable, phase order, unbalance, frequency, load current, kvar demand and the SVG’s output current. Correlate the trace with production states. A short measurement during a quiet shift cannot establish the worst case for a rolling mill, compressor bank or VFD process.
O Lista de verificação para a implementação do SVG explains how to preserve synchronized traces. Those records are especially valuable when output appears to fall only during a voltage sag or a high-load transition.
For a complete review, also compare the measured kvar with the Guia de compensação de corrente reativa SVG. It explains why a converter can show output while the source still sees reactive current when the CT boundary, priority or shared current budget is different from the assumed design.

Check the capability curve, not only the nameplate
Ask the supplier for the allowed voltage range, continuous and short-time current, ambient derating, switching frequency constraints, overload duration, protection thresholds and the effect of simultaneous compensation functions. The useful question is: “At our minimum and maximum measured voltage, ambient and harmonic duty, how much reactive current is guaranteed at the control point?”
Check whether the published kvar is based on a particular voltage. Some specifications are stated in amperes, some in kvar at nominal voltage, and some show separate curves for voltage and temperature. Convert units consistently before comparing alternatives. Also confirm whether the output rating is per phase, total three-phase, or a controller setting that is lower than the hardware limit.
A practical capacity review
Use this sequence before changing a setpoint or ordering a larger unit:
- Define the compensation point and the required power-factor or voltage objective.
- Record minimum, nominal and maximum voltage during representative production states.
- Calculate the required reactive current at each voltage, including a reasonable margin.
- Add harmonic, unbalance and transient duties that share the converter current budget.
- Compare the result with the supplier capability curve at the measured ambient and installation method.
- Check feeder, breaker, cable, transformer and cabinet heat limits for the selected current.
- Test the worst case with synchronized voltage, load, output current and alarm records.
Voltage drop inside the installation
An SVG may see a different voltage from the bus that the plant meter reports. Long cables, a lightly sized transformer, loose terminations or a high-current step can create a local drop. Measure at the SVG terminals and at the reference bus during the same event. If the difference is material, correct the installation or revise the control boundary before blaming the converter.
Voltage drop also affects parallel equipment. Two modules connected to different sections of a switchboard can measure different waveforms and divide current unevenly. Confirm the bus arrangement, cable impedance, phase sequence and CT placement before assuming that adding a module increases usable capacity linearly.
Interactions with capacitors and other converters
Fixed capacitors, APFC stages, VFD front ends, generators and UPS systems all influence the voltage and reactive-current requirement. A capacitor stage that switches in during a low-load period can make the SVG reduce inductive compensation or become temporarily leading. A generator can change short-circuit strength and voltage regulation. The SVG vs capacitor bank comparison gives selection context, but the site study must include the actual switching sequence.
Do not solve an apparent voltage-capacity problem by forcing the SVG to a higher output limit. That can hide a measurement error or cause repeated protection trips. Separate the questions: Is the voltage within tolerance? Is the requested current physically available? Is another device creating the demand? Is the control point correctly defined?

Acceptance test for voltage-dependent capacity
Write acceptance cases before energization. Include nominal voltage, the lowest normal operating voltage, the highest normal voltage, peak reactive demand, a representative harmonic load and the light-load condition that may create leading power factor. For every case record voltage at the SVG and reference point, current, kvar, power factor, temperature, alarms and active control mode.
Allow the system to reach steady state before comparing values. A short transient can be useful for response testing but should not be mixed with continuous capacity. If the output is limited, record the limit indication and the voltage at the moment it occurs. The result should state whether the limitation is electrical capacity, thermal derating, protection, measurement or another enabled function.
For measurement practice, IEC 61000-4-30 provides a framework for power-quality measurement methods and aggregation; it does not replace the SVG manufacturer’s commissioning procedure. The IEC catalogue entry is the authoritative source for the standard scope.
Perguntas frequentes
Does lower voltage always mean lower SVG kvar?
Not instantly or in every control mode. With a fixed current limit, lower voltage reduces the kvar that current can represent. The controller may also have short-time headroom or a different limit, so use the approved capability curve and measured voltage.
Can higher voltage be used to increase the SVG rating?
No. Higher voltage may increase theoretical kvar for a fixed current, but insulation, protection, thermal and control limits still apply. Never change the operating voltage or protection setting to obtain more output.
Why does the SVG limit output only during production peaks?
The peak may combine low bus voltage, higher reactive demand, harmonics and ambient heat. Compare synchronized voltage, load and output-current traces with a quiet period to identify which limit is active.
What should be written in an RFQ?
Specify voltage range, frequency, phase/wire system, required current or kvar at each voltage, compensation point, harmonic duty, ambient, overload expectation, installation type, communication, protection and acceptance evidence.
Conclusão
Grid voltage is part of the SVG capacity calculation, not a footnote. Measure the real voltage boundary, translate the required kvar into current, account for functions that share the converter and validate the result against the supplier’s capability curve. A documented voltage-dependent test gives procurement, commissioning and maintenance teams the same defensible answer about what the SVG can deliver.
Neutral video: power-quality measurement background
The NPTEL lecture below is general educational context for power-quality measurement. It is not a model-specific SVG procedure.
