


Active Harmonic Filter Response Time Explained: What to Measure
Active harmonic filter response time is the interval between a meaningful change in harmonic-producing load and the filter’s compensating effect at a specified measurement point. A product brochure’s single “response time” number is hard to compare unless it states the load step, the measured signal, the start and end definitions, and the conditions under which the test was made. For an engineering decision, ask whether the AHF reduces the relevant source-current harmonics quickly enough during the real process event, without excessive overshoot, alarms or a loss of steady-state performance. Then verify that behavior with synchronized measurements. Faster is not automatically better if the filter lacks current capacity, is located incorrectly, or follows a misleading CT signal.
This guide separates detection, current-injection and settled-result measurements. It does not assign a response-time specification to any CNBYG model. Check the exact installed model’s datasheet and approved test method before setting a procurement limit or making a compliance claim. Testing on energized industrial power systems must be planned and performed by qualified personnel under the site’s safety rules.
Why the advertised number can mislead
An AHF continuously measures current, estimates the unwanted components and commands its inverter to supply a compensating current. Each part contributes delay. The plant’s own load does not always change as a clean mathematical step: variable-speed drives ramp, rectifiers conduct in pulses, capacitor stages switch, and multiple machines may change state together. A laboratory test with one repeatable step is valuable, but it is not a direct prediction of the field result in every operating state.
Published research compares active-filter control methods by their transient behavior. For example, an IEEE conference study specifically contrasts methods using source-current and load-current detection under transient conditions. It demonstrates why the control and sensing arrangement matter; it does not establish a universal millisecond target for all commercial equipment. Another IEEE experimental study discusses dynamic characteristics of a particular prototype. Neither result should be copied into a CNBYG specification without model-specific evidence.
Even within one unit, the reported “time” may refer to the first visible change in injected current, the point where source-current distortion reaches a target, or the duration until a steady band is maintained. Those are different outcomes. A comparison that omits the definition can rank the wrong product first.
Define the event, signal and endpoint before testing
For a useful site test, state the event precisely: which nonlinear load changes, from which starting state, how rapidly it changes, and whether other compensation devices are operating. Capture at least load current, source current, AHF output current and voltage on the relevant phases. If the concern is a contractual harmonic objective at the point of common coupling (PCC), include measurements there. A local feeder response can be fast while the PCC still reflects other loads.
Choose a start marker tied to the actual electrical event, not the operator’s button press or the time a supervisory system logs the command. Possible markers include the measured change in load current or a synchronized process contact that is demonstrably aligned with it. Define the endpoint as a measurable condition, such as entry into a pre-agreed error band that remains stable for a stated period. The error band and holding period belong in the test plan. Without them, two analysts can extract different times from the same waveform.
Use a synchronized acquisition setup with enough temporal resolution for the claimed response. A slow dashboard trend cannot verify a faster transient. IEC 61000-4-30:2025 describes power-quality measurement methods and repeatability for AC systems; its scope includes voltage and current harmonics. For a rapid transient test, the engineer must also select a suitable waveform recorder and sampling setup. Do not present a conventional long-interval THD trend as a direct measurement of sub-interval control response.
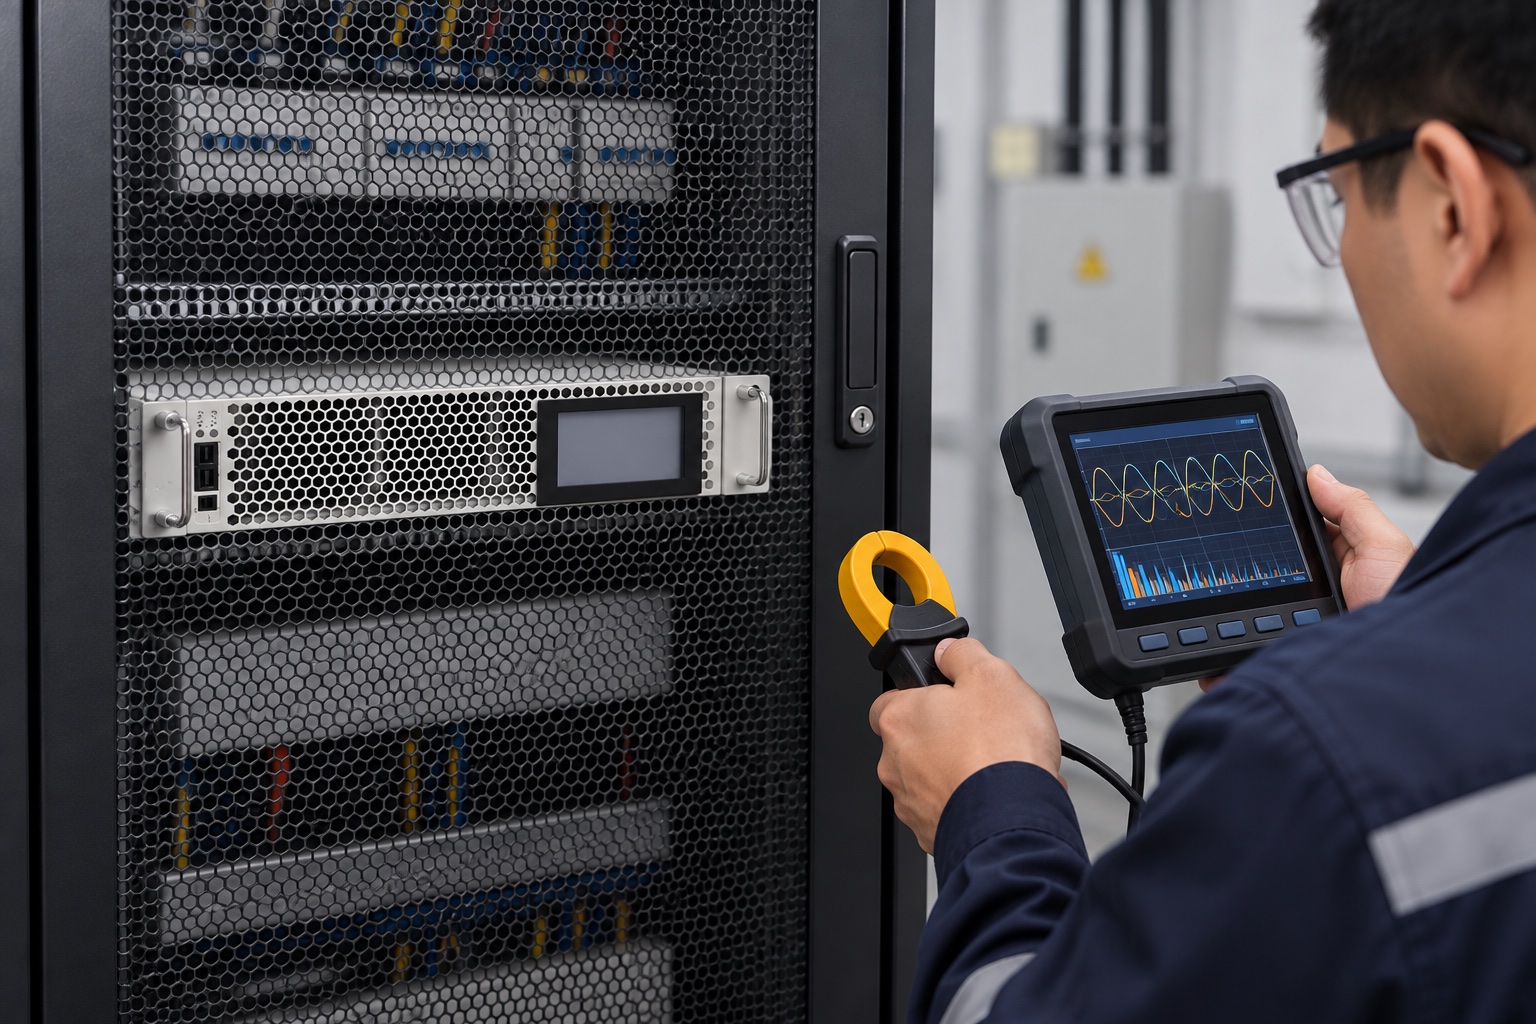

Image: a product-referenced rack AHF in an illustrative test setting; the screen shows no measured site result.
Separate four useful timing concepts
The table keeps common terms from being collapsed into one marketing figure. These are operational definitions for a test plan, not claimed performance values.
| Term | What starts it | What ends it | Practical use |
|---|---|---|---|
| Detection or estimation delay | Measured load-current change | Controller has identified a new compensation requirement | Helps diagnose sensing and algorithm behavior; may not be directly exposed by a commercial controller |
| Initial injection response | Measured load-current change | AHF output current first changes in the intended direction | Shows reaction has begun, but not whether the result is adequate |
| Settling time | Measured load-current change | Relevant source-current error enters and remains inside a defined band | Describes usable compensation after the event |
| Recovery after saturation or alarm | Peak event or limiting condition ends | Normal compensation and alarm state return | Matters when the process frequently exceeds available capacity |
For an order-specific question, track that order’s current amplitude over time as well as the overall waveform. A filter could quickly reduce one dominant order while another component remains. For a process where equipment trips during a short peak, the transient peak and recovery may matter more than the eventual steady-state THD. For a continuous-load facility, stable output and thermal performance may be the larger issue.
Design a repeatable site test
Begin with a documented single-line diagram, AHF location, CT locations and ratios, instrument connection points, operating mode, current-capacity setting and the pre-test alarm log. The AHF commissioning procedure covers broader startup checks. Here, the focus is on a controlled comparison after the installation has been verified.
Select a load transition that the plant can safely repeat and that represents the real complaint. If a VFD-controlled process is the concern, record drive speed, torque or process state alongside the current traces. Avoid deliberately creating a hazardous disturbance merely to obtain a clean waveform. Capture a stable pre-event baseline, the whole transition, and a sufficiently long post-event period. Repeat the event several times if operations allow, and note any runs where other equipment switched simultaneously.
Measure the same signals with the AHF in the approved comparison states. Where isolation or bypass is involved, follow the manufacturer’s and facility’s switching procedures; do not improvise a live bypass. The before/after runs need comparable load and network conditions. If the site’s source impedance or capacitor-bank state changes between runs, the difference cannot be assigned confidently to the AHF.
Keep the raw waveforms and time stamps. A screenshot of the “best” trace omits the measurement context. If the analyzer computes harmonic quantities in windows, document the window and update rate so readers know how much smoothing is present. The IEC 61000-4-7 publication addresses harmonic and interharmonic instrumentation, which is relevant to how reported harmonic values are formed. It is not a substitute for the high-speed waveform record used to mark a rapid response event.
Read the traces without overclaiming
Place load current, AHF output current and source current on one synchronized time base. Mark the measured load-change instant and the endpoint defined in the test plan. Compare multiple cycles or repeated events. Look for delayed onset, overshoot, oscillation, phase imbalance and recurring current limiting. Inspect both the time-domain waveform and an order-resolved harmonic view. A filter that reacts promptly but reaches its current ceiling may show a poor final result because of capacity, not because its controller is slow.
Research on four-wire active filters illustrates that dynamic response is a system property involving control strategy and topology. An open research article in Energies includes transient operation and controller-response analysis for a particular experimental design. Treat such findings as context for the test method, not as a performance representation of the equipment in this article.
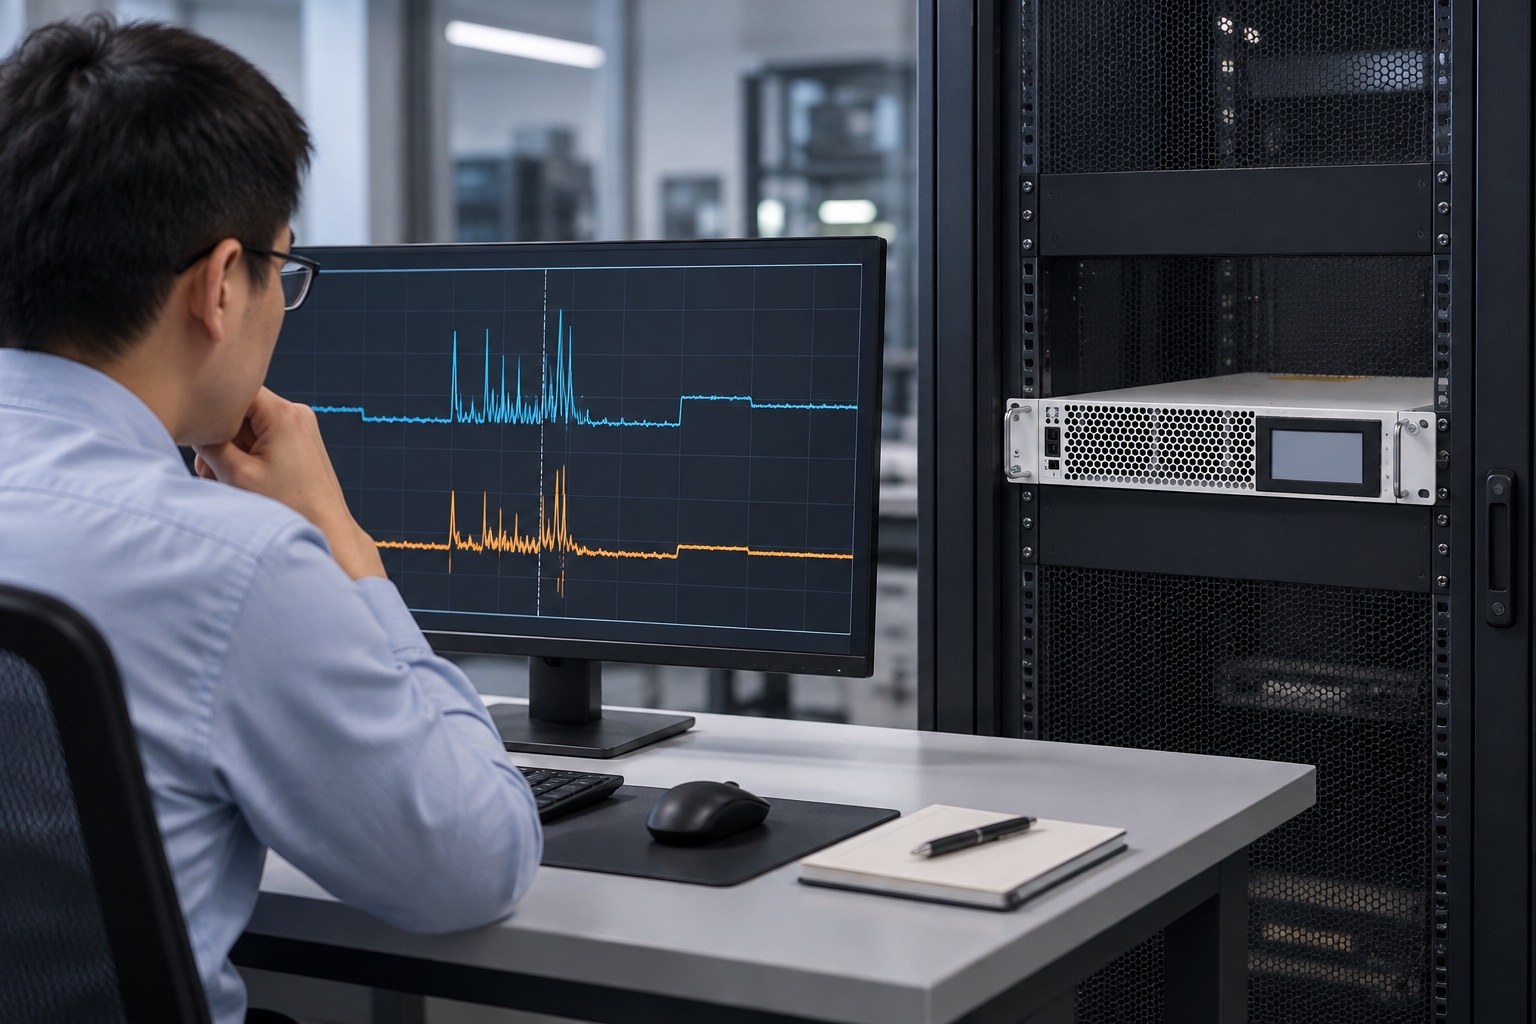
Image: an illustrative event-log review; the traces are not a measurement or specification for CNBYG equipment.
Why a fast AHF may still disappoint at the PCC
Response time and harmonic-control effectiveness are related but not interchangeable. An undersized unit can react quickly and still leave substantial harmonic current. Incorrect CT location, polarity or ratio can make it compensate the wrong signal. A long feeder, shared bus, changing capacitor stage or parallel nonlinear loads can change what appears at the PCC. A measurement taken only at the AHF terminals may not answer the utility-facing question.
เดอะ IEEE 519-2022 standard frames harmonic-control design goals at the PCC. It does not state that a particular AHF transient time proves compliance. Separate the field report into two sections: dynamic response under defined load steps, and harmonic performance under representative steady operating periods. The AHF harmonic-priority guide explains how to allocate compensation effort after the baseline is credible; the working-principle article explains why sensing and injection must be considered together.
Where the purchase decision depends on fast load swings, ask the supplier for a test report using a load step, voltage, wiring configuration, operating mode and measurement endpoint comparable to your site. Request the raw traces or a clearly annotated waveform. Be wary of a graph with no axes, no event marker or no definition of when the clock stops. The CNBYG rack-mount AHF product page identifies the product family depicted here; a buyer should obtain the actual model documentation before assigning a response-time value.
A neutral explanation of the control dynamics
IIT Roorkee’s Shunt Active Power Filter III lecture introduces state-space modeling and control concepts for shunt active filters. It helps explain why control design influences transient behavior. It is an educational background resource, not an operating instruction for the CNBYG unit.

คำถามที่มักถูกถาม
Is response time the same as the time to reach a low THD value?
No. Initial current injection, settling of a selected waveform error and a long-interval THD result use different endpoints and averaging. Define the metric and measurement point before comparing figures.
Can a dashboard trend prove a millisecond response claim?
Usually not by itself. The instrument’s sampling, calculation window and update interval must resolve the event. Preserve a synchronized waveform capture for rapid timing and use trend data for longer operating behavior.
Does a faster filter always solve an intermittent harmonic problem?
No. Capacity, CT configuration, filter location, source conditions and the process event can dominate the outcome. A fast but current-limited unit may still leave a large upstream harmonic during the peak.
What should a supplier include in a response-time test report?
The exact model and firmware, system voltage and wiring, initial and final load states, event definition, measurement points, instruments, raw or annotated traces, start/end rules, repeated trials and any current-limit or alarm behavior. Without those details, a number is not readily comparable.
What a useful handover looks like
A complete response-time record combines the site’s test plan, safety approval, circuit diagram, synchronized waveforms, load-state log, instrument settings, run-by-run event timings, steady-state harmonic results and open limitations. It says which result was seen at the feeder and which was seen at the PCC. This lets operations staff retest after a drive, transformer, capacitor bank or production profile changes instead of relying on a brochure figure that may describe a different condition.