Reactive Power Compensation for Steel Rolling Mills
Steel mill reactive power compensation should be based on the rolling process, drive arrangement and measured demand cycle. For a rolling mill, record active and reactive power during billet entry, rolling passes, acceleration, deceleration and idle intervals before selecting compensation. Separate rolling-drive behaviour from electric arc furnace behaviour if both exist at the site. A plant-wide average power factor can hide short demand changes, light-load overcorrection and distortion-related problems. The design must define its measurement boundary, response requirement and verified equipment functions, together with acceptance tests that reproduce representative production conditions.
Define which part of the steelworks the project covers
A steelworks may contain furnaces, rolling stands, auxiliary drives, cooling systems and material-handling equipment. These loads do not necessarily have the same reactive-power pattern or supply voltage. Mark the rolling-mill project boundary on the single-line drawing and identify the transformer, switchboard and feeder measurements included in the proposal.
If the site also operates an electric arc furnace, retain that load as a separately identified source of disturbance. An arc-furnace flicker study cannot be copied directly into the specification for a rolling-drive board. Conversely, measurements at a rolling feeder may not explain voltage changes caused elsewhere on a shared network.
Obtain the drive documentation. Different converter and front-end arrangements can have different reactive and harmonic characteristics. Do not assume that every variable-speed drive requires the same correction, or that a modern drive eliminates every power-quality concern. State the actual equipment population and identify any documentation still missing.
The existing arc furnace harmonics and APF boundaries guide addresses the furnace-specific question. This article focuses on the rolling cycle and the evidence required to specify fundamental reactive compensation.
Synchronise electrical records with rolling passes
Create a process-event list with the mill engineers. Record the product programme, active stands, drive states and permitted supply configuration. Align electrical instrument clocks with the production log. Without that alignment, a reactive-power spike cannot reliably be assigned to billet entry, a speed change or an unrelated auxiliary load.
Measure repeated cycles rather than one selected pass. Include a representative range of products or operating programmes where these materially change the electrical demand. Preserve the sampling and aggregation settings: a long averaging interval can conceal the demand variation relevant to a fast compensation task.
Retain active power, reactive power, apparent power, relevant power-factor quantities, voltage and current at the agreed boundary. Also capture the status of existing capacitor stages or dynamic equipment. A net reactive-power record with the old compensator enabled is a different baseline from a record with it disabled under an approved test arrangement.
Choose power quantities that answer the question
Displacement power factor concerns the fundamental voltage-current relationship. True power factor also reflects the relationship between total active and apparent power under distorted conditions. Correcting fundamental reactive demand does not automatically eliminate the current distortion that reduces true power factor.
IEEE 1459-2025 provides definitions for power quantities under sinusoidal, nonsinusoidal, balanced and unbalanced conditions. Identify which quantities the survey instrument exports and how it treats sign. Do not mix one instrument’s displacement factor with another instrument’s true-power-factor column in the same unexplained calculation.
Regenerative operating intervals require careful interpretation of active and reactive power direction. Keep signs in the data and agree their meaning with the drive and metering documentation. A power-factor number alone can become misleading near low active power or a change in power direction. Use the underlying P and Q records to explain what happened.
For further detail on the measurement distinction, see the displacement and distortion power-factor logging guide. It supplies the quantity definitions needed before choosing a correction range.
Build a rolling-cycle decision table
| Operating interval | Measurement evidence | Engineering decision |
|---|---|---|
| Billet entry and initial loading | Timestamped P, Q, voltage and drive state | Identify the actual demand change and its duration |
| Stable rolling pass | Repeated power and current records at the same boundary | Establish the sustained correction range |
| Acceleration or deceleration | Signed active/reactive power with speed-state notes | Check changing demand without losing direction information |
| Gap between billets | Remaining reactive demand and enabled correction stages | Assess light-load overcorrection risk |
| Auxiliary-only operation | Pump, fan and handling-load status | Define the minimum operating condition |
| Shared furnace activity | Separate feeder records and common-bus voltage | Distinguish rolling demand from upstream or adjacent disturbances |
| Approved alternative source | Source configuration and permitted production state | Establish a separately validated operating mode |
The table defines evidence to collect, not universal response times or device settings. Select the recording method and safe test arrangements with the responsible engineers. Where a disturbance occurs faster than the instrument can resolve, record that limitation instead of presenting an averaged trace as a complete dynamic measurement.
Estimate the range before selecting hardware
For a balanced sinusoidal operating state, Qc = P × (tan φ1 − tan φ2) gives an initial fundamental reactive-correction estimate. Express P in kW and Qc in kvar. The initial and target factors must be displacement power factors consistent with the calculation assumptions.
For example, an invented 800 kW operating state moving from 0.85 to 0.95 displacement factor gives tangent values of approximately 0.620 and 0.329. The estimate is 800 × (0.620 − 0.329), approximately 233 kvar. These are teaching inputs, not a rolling-mill measurement or a recommended CNBYG product size.
Repeat the assessment across the pass cycle and idle intervals. Define the range, direction and duration of the measured correction task. State whether the proposed equipment replaces an existing bank or supplements its remaining effective capacity. Avoid adding the existing bank’s correction twice when working from an already compensated baseline.
Do not use this calculation to claim a required response time, voltage-flicker improvement or guaranteed true power factor under distorted conditions. Those outcomes require their own evidence and acceptance criteria. A single peak kvar value is only one input into a dynamic compensation specification.
Compare correction technologies against the cycle
A fixed capacitor arrangement can suit a sufficiently stable and coordinated task. Its suitability depends on the connected load, switching, discharge and network conditions. A mill with substantial idle gaps needs an explicit check of what remains energised between passes and during a production stop.
A stepped capacitor bank changes correction in discrete increments. Compare stage size and switching capability with the actual demand variation. Check contactor or switching-device suitability, controller behaviour and stage condition from verified documentation. Frequent switching is a diagnostic observation, not automatic proof that the controller needs a longer delay.
Dynamic reactive compensation can be considered where the recorded operating range and response requirement justify it. Compare the proposed device’s verified correction range, electrical connection, thermal performance and control method. Do not infer harmonic filtering or a specific flicker reduction from an SVG product name.
The CNBYG SVG product page provides a relevant starting point for a measured-duty enquiry. The SVG sizing guide for dynamic loads supports the separate discussion of range and response. Final selection must be model-specific and consistent with the actual installation voltage and study.
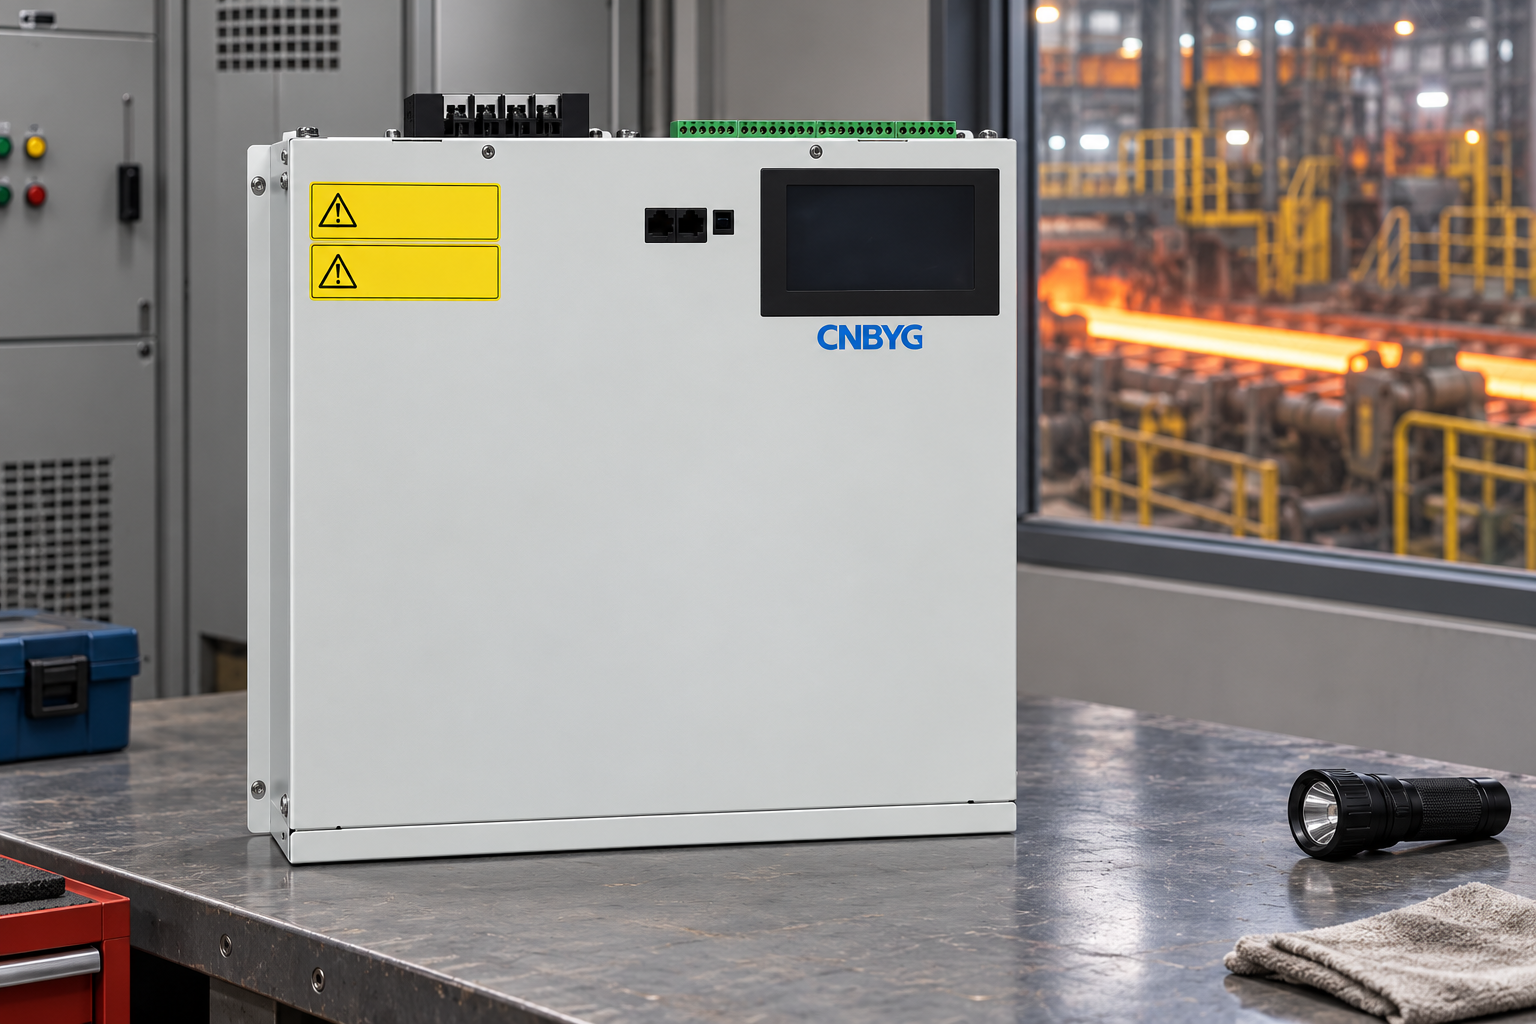
This product-reference illustration shows a closed, disconnected enclosure. It does not depict an approved installation, establish a correction capacity or demonstrate direct connection to a medium-voltage rolling system. Warning text is simplified; use actual equipment documentation for installation and safety.
Study network interaction and disturbance boundaries
Capacitors, reactors, transformers and nonlinear loads interact through the network. Review existing banks and drive arrangements before adding correction. A network change, transformer substitution or different number of operating stands can alter the conditions on which the original design was based.
IEEE 519-2022 describes harmonic control at the supply interface. Establish the correct assessment boundary and criteria. An internal rolling-drive current spectrum is useful diagnostic evidence, but it is not automatically the utility-interface acceptance result.
Keep harmonic distortion, voltage fluctuations and fundamental reactive demand as separate assessment topics. They can be related without sharing the same remedy. If the project includes flicker performance, specify the applicable measurement method and required evidence independently rather than assuming that an improved average PF demonstrates success.
A short voltage event during a pass may have several possible causes. Compare synchronized feeder and upstream records before attributing it to inadequate compensation. Retain transformer configuration, drive state and adjacent heavy-load operation in the investigation so that the proposed solution follows the observed mechanism.
Coordinate location, sensing and control
Compare compensation at a rolling section board with compensation at the wider plant boundary. Identify which feeder current or commercial measurement each arrangement is intended to improve. Include the effects on upstream reactive current and the limits of any downstream measurement claim.
Mark current-sensor locations, phase association and control boundaries on the final drawing. Where several compensators operate, define how their responsibilities are separated or coordinated. Commissioning should confirm the signal polarity and response using an approved procedure, with settings retained in the handover package.
Assess the actual service-room environment, cooling requirements and maintenance access. The fact that the application is a steel mill does not define an enclosure rating or ambient temperature. Obtain model-specific installation limits and document any site conditions requiring further engineering before purchase.
Agree acceptance before commissioning
Define representative passes, idle states and permitted source configurations before installation. Use consistent instrument definitions and recording intervals in the baseline and acceptance surveys. Explain changes in the product programme or number of operating stands rather than attributing every different trace to the compensator.
Evaluate the agreed P and Q range, relevant power-factor quantities, voltage behaviour, harmonic criteria and equipment status. Test low-load conditions and coordination with existing correction. Where a supply configuration or product programme remains untested, list it as outside the verified result and set a review action.
Hand over raw measurements, settings, drawings, equipment documentation and a record of the accepted operating conditions. A later drive replacement or process change should trigger review. Any financial estimate must use the actual tariff and billing evidence; a higher power factor does not prove an equivalent reduction in rolling energy consumption.
Further learning: standards and monitoring
The NPTEL IIT Delhi lecture on power-quality standards and monitoring provides educational background for measurement and acceptance boundaries. It does not select a rolling-mill compensator or replace the project study.
Watch Power Quality: Standards and Monitoring
Frequently asked questions
Is a rolling mill the same compensation task as an arc furnace?
No. Define the loads and boundary separately. Furnace-related disturbances can affect a shared network, but rolling-drive duty and equipment selection require their own measurements.
Can one maximum kvar reading determine the SVG size?
No. Retain the required correction range, direction, duration, operating states and documented device limits. A peak reading does not establish dynamic response or light-load behaviour.
Does a better power factor prove flicker has been solved?
No. Voltage fluctuation or flicker performance needs its own agreed measurement and acceptance evidence. Average power factor alone cannot demonstrate that outcome.
What should a rolling mill enquiry include?
Provide the verified single-line diagram, drive population, synchronized pass-cycle P and Q records, harmonic evidence, existing compensation, source configurations, installation conditions and acceptance criteria.