How to Size an SVG for Rapidly Changing Loads
SVG sizing for dynamic load requires a time record of reactive-power demand, not only the plant’s average power factor or the sum of motor nameplates. Identify the largest relevant reactive-current requirement, how quickly it changes, how long it persists, and which supply configurations must be supported. Then compare that demand with the generator’s documented current capability, voltage conditions, operating limits, and control response. A unit can have enough nominal kVAR yet fail to meet the intended result during a load transition. Conversely, an occasional peak should not automatically justify unnecessary capacity without a defined acceptance requirement.
Define the result the installation needs
Start with the business and engineering problem. Is the objective to reduce a sustained reactive demand charge, maintain an agreed power-factor range, support a rapidly changing industrial process, or coordinate with an existing capacitor bank? Those goals require different observation and selection criteria.
State the measurement boundary and target explicitly. An incoming plant meter, a dedicated process feeder, and an individual machine can show different reactive-power patterns. A compensator selected for one boundary should not be assumed to solve every downstream problem. Include the loads and compensation branches represented by the intended CT arrangement.
The CNBYG SVG product page supplies the relevant product-family context. Confirm the actual model’s current capability, topology, supported functions, and control arrangements from its approved technical documentation. The pictured rack enclosure does not establish a particular kVAR rating or response specification.
Record reactive demand over time
Use suitable metering to record active power, the relevant reactive-power quantity, voltage, current, and operating state. Retain the sign convention so inductive and capacitive demand are not accidentally combined as positive magnitudes. Record the meter’s aggregation interval; a slowly averaged trend can hide a brief but important process change.
Capture representative production cycles, shift transitions, major starts and stops, and planned supply arrangements. Include light-load periods and operation of any existing capacitor bank. The observation duration should cover the actual process question rather than follow a fixed universal recording period.
For a balanced sinusoidal planning calculation, reactive compensation can be estimated from Qc = P × [tan(arccos(PF1)) − tan(arccos(PF2))], with P in kW and Qc in kVAR. That formula does not describe every unbalanced or distorted waveform, and an average input does not reveal a dynamic peak. Use it as a bounded arithmetic check, then reconcile it with measured demand and the intended compensation function.
The U.S. Department of Energy motor-system guide includes power-factor-correction context. It is a planning reference, not an SVG performance guarantee or a source of universal dynamic response values.
Separate sustained demand from short events
An operating cycle can contain a sustained reactive requirement, occasional brief peaks, and a reversal of demand when loads stop or capacitors remain connected. Preserve these distinctions. A single maximum value without duration tells little about thermal loading, required tracking, or the consequences of a brief residual error.
For illustration, consider a process that needs 40 kVAR through most of a cycle and 75 kVAR during a short stage. Those are hypothetical engineering inputs, not measured CNBYG performance. The selection question is whether the project must fully cover that short stage, how often it occurs, and what documented operating capability is available.
Do not assume that a catalogue unit can exceed its continuous rating for an arbitrary duration. Any overload capability must be explicitly supported by the exact model documentation. Likewise, do not ignore a peak merely because the monthly average is low. The accepted operating result determines which parts of the time record matter.
Build a selection evidence table
| Selection input | What to measure or obtain | Decision it supports |
|---|---|---|
| Reactive demand envelope | Signed demand over representative cycles | Continuous and required peak compensation |
| Transition behavior | Event timing and appropriately resolved trends | Required control tracking and verification |
| Supply voltage | Relevant operating range and configurations | Available current-to-kVAR capability |
| Phase balance and topology | Per-phase currents and three-wire/four-wire records | Supported compensation arrangement |
| Shared functions | Enabled reactive, imbalance or harmonic objectives | Allocation of documented current capability |
| Environment | Ambient and cooling conditions at the equipment | Documented rating and derating assessment |
| Existing compensation | Capacitor stages and controller sequence | Coordination and light-load behavior |
The table organizes inputs without prescribing a universal safety margin. A defensible allowance reflects measurement uncertainty, plausible load growth, operating variation, and the manufacturer’s permitted envelope. Explain each allowance rather than adding an unexplained percentage to every project.
Translate the demand into current capability
For a balanced three-phase sinusoidal reactive-current relationship, Q in kVAR is approximately square root of three multiplied by line-to-line voltage in volts and reactive current in amperes, divided by 1000. At a hypothetical 400 V, a 100 A reactive current corresponds to about 69.3 kVAR under those assumptions.
This calculation illustrates why voltage and current limits matter. If voltage changes while the permitted current remains fixed, the corresponding reactive-power capability changes. The actual equipment’s controls, operating range, topology, and thermal conditions still determine the usable rating; the arithmetic is not permission to operate outside documentation.
The SVG voltage and output-capacity guide addresses that boundary in more detail. For a general first selection, the SVG capacity-selection guide provides broader context. This article concentrates on the time-varying demand that a single steady-state calculation misses.
Verify the meaning of a response-time claim
Ask what the stated response time measures: sensing, calculation, current command, output-current establishment, or settling to a defined result at the plant meter. Those are different stages. A fast internal controller does not necessarily imply an equally fast stable result at every measurement point.
Describe the load event and the allowed residual reactive demand during it. Require the supplier’s response specification to state test conditions and the measured quantity. Where the installation combines several devices, the overall behavior includes sensing, coordination, and network effects as well as the SVG itself.
Avoid commissioning by repeatedly changing settings until one display looks favorable. Use an approved test plan with representative load transitions, documented settings, and clear stop criteria. Preserve the event records and evaluate tracking, stability, and protection status together.
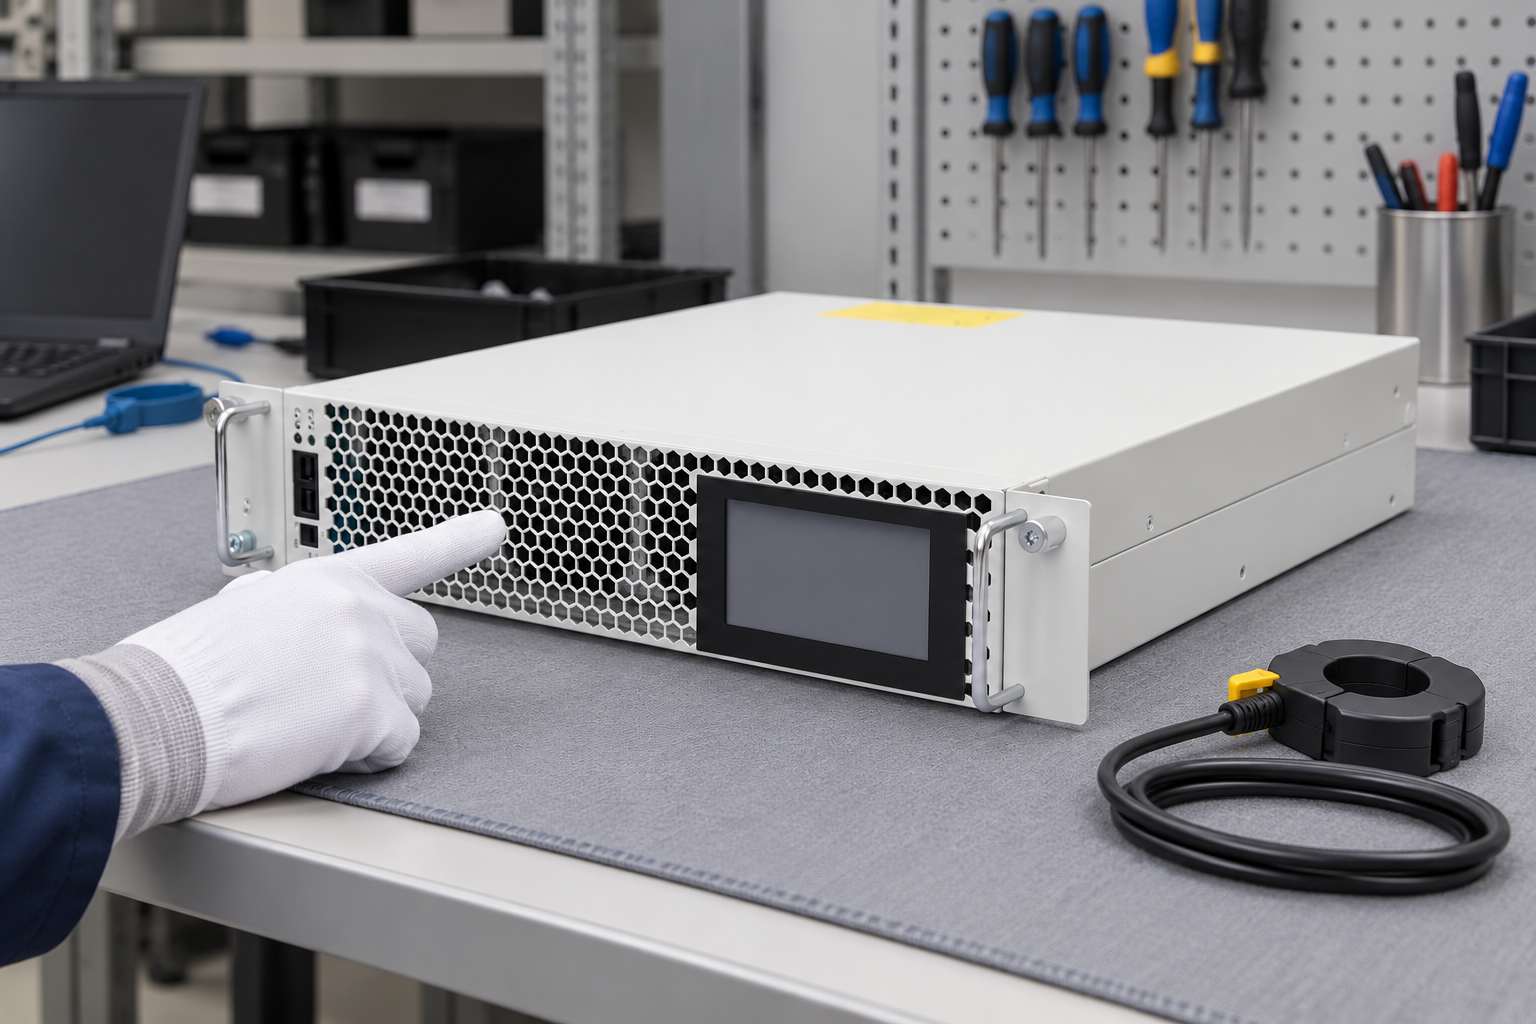
The reference illustration shows the closed rack module before inspection. It does not demonstrate a dynamic test or an actual response time. The accepted result requires measurements from the installed system under defined conditions.
Coordinate the SVG with capacitor stages
An existing capacitor bank can handle part of the sustained reactive requirement while the SVG addresses the remaining demand, but that division must be designed and verified. Record stage sizes, switching delays, reconnection eligibility, controller targets, and the changing residual demand observed by each controller.
Pay particular attention to a sudden load reduction. Capacitor stages that remain connected can leave capacitive demand, and the SVG’s required direction and capacity may change. Do not assume every model has the same bidirectional capability or control priority. Confirm the exact operating functions and the approved sequence.
Review harmonic conditions before expanding capacitance. Reactive compensation and harmonic mitigation are related power-quality tasks, but they are not interchangeable. The power-factor compensation meaning guide helps distinguish the intended objective from a general claim that all power-quality problems disappear.
Include growth and degraded operation deliberately
Specify likely future loads and the evidence behind them. If a production expansion is only a possibility, separate it from confirmed demand so the procurement decision remains transparent. Explain whether future capacity will be installed initially or accommodated through a documented expansion arrangement.
Define the required behavior when one module is unavailable, if redundancy is part of the project. The available healthy capacity matters more than the original purchase total. The parallel SVG expansion guide supports planning of modular arrangements, but coordination must be checked for the actual model and installation.
Environmental and supply conditions also belong in the selection record. Cooling, enclosure arrangements, and operating voltage can affect documented capability. Do not describe these as arbitrary additional margins; compare them with the permitted operating envelope and retain the basis for the chosen rating.
Validate the selected system after installation
Record the approved sensing arrangement and settings before testing. Confirm representative load states, instrument configuration, and event timing. Where a deliberate load change is permitted, follow the responsible engineer’s plan. Do not create an unsafe switching event simply to obtain a demonstration.
Evaluate the result across the relevant process cycle, including light-load and transition conditions. Check residual demand, operating stability, current limiting, and thermal or protection events. Retain the data that supports acceptance and identify any remaining conditions requiring a different arrangement.
The NPTEL power-system analysis lesson on shunt compensation provides educational context for reactive compensation. The video below adds monitoring context for recording the system result. Neither source replaces the chosen SVG’s technical documentation.

Watch Power Quality: Standards and Monitoring
Frequently asked questions
Can average monthly power factor determine SVG size?
It can help identify a sustained problem but does not describe the dynamic reactive-demand envelope. Record representative signed demand, transitions, voltage, and operating conditions before selecting equipment for rapidly changing loads.
Should an SVG always cover the largest recorded peak?
The acceptance requirement determines that decision. Record peak magnitude, duration, frequency, and consequence, then compare them with documented capability. Do not assume undocumented overload operation or ignore a significant event solely because it is brief.
Does the nominal kVAR rating remain available at every voltage?
Do not assume that. Current limits, voltage range, topology, and operating conditions determine usable capability. Confirm the exact model documentation and reconcile the reactive-current calculation with the stated rating.
How do I prove the chosen size is adequate?
Use the approved measurement boundary, representative load cycles, documented settings, and appropriate instruments. Verify residual reactive demand, tracking, stable operation, and protection status through the conditions that motivated the selection.