Modbus Diagnostic Logs: Capture Useful Request and Response Evidence
A useful Modbus diagnostic log connects each request and response to the correct meter route, timestamp, configuration and reported symptom. Capture enough context to reproduce the interpretation, while limiting collection to an authorized read-only investigation. A screenshot saying “communication failed” is rarely sufficient: the next engineer needs to distinguish a timeout, exception response, malformed frame, decoding error and application quality decision without guessing what was actually exchanged.
This guide covers evidence capture and handover. It does not recommend scanning a live control network, sending undocumented requests or changing meter settings. Obtain site authorization, respect operational constraints and use supported diagnostic facilities. Electrical inspection and invasive network work belong to qualified personnel following the site’s procedures. Where passive capture is unavailable, work with the system owner on an approved alternative.
Define the question before collecting packets
Write a short symptom statement. For example: a gateway reports a timeout for one read operation after a planned configuration change, while other devices remain available. Include the affected asset, start time, frequency, application message and expected behavior. This focuses collection on the relevant route and avoids accumulating large files with little diagnostic value.
Separate communication success from useful engineering data. A valid response can still be decoded with the wrong byte order or associated with the wrong measurement. A good capture therefore records the request and response alongside the register-map revision, data type, scaling and application point. The guide to register-map revision control explains how documentation drift can produce believable but incorrect values.
Do not promise that one capture will establish the root cause. Intermittent faults may require several bounded observations under comparable conditions. Record what the evidence can and cannot prove, such as whether collection occurred upstream of a gateway rather than on the actual serial segment. That limitation is central to interpreting the result.
Identify the observation point and protocol
Modbus RTU and Modbus TCP provide different evidence. A serial frame includes an error-checking field appropriate to the serial protocol. Modbus TCP uses its own application header and runs over TCP. A gateway may translate between them, so an upstream TCP trace does not necessarily show the complete downstream serial exchange or its timing.
The Modbus serial line specification and implementation guide explains serial addressing, frame handling and the request-response transaction model. Use it to classify the exchange, then use the exact meter manual for implemented registers and supported operations. Protocol documentation alone cannot establish a particular device’s register layout or tell you which optional features are fitted.
Record the collection location in plain terms: gateway diagnostic export, application log, managed network capture or approved serial diagnostic facility. Include whether the source records original frames, decoded summaries or only application events. A decoded log may omit bytes needed to resolve an endianness dispute; a raw packet capture may omit the application quality decision that caused a dashboard alarm.
| Evidence field | Why it matters | Common omission | Acceptance check |
|---|---|---|---|
| Asset and full route | Distinguishes repeated addresses on different segments | Address recorded without gateway port | Route matches maintained configuration |
| Measurement timestamp and clock basis | Supports event correlation | Arrival time mistaken for sample time | Time zone and clock uncertainty documented |
| Request and response or timeout | Separates protocol outcomes | Only the final error message saved | Both sides linked where available |
| Register-map revision | Supports decoding | Generic family manual attached | Exact variant documentation identified |
| Application point and quality | Explains the displayed result | Valid frame assumed to mean valid data | Raw exchange traced to reporting behavior |
| Collection method and limitations | Defines what was observed | Upstream trace treated as downstream proof | Observation boundary stated explicitly |
Save a minimal configuration baseline
Before collection, export or record the relevant connection settings using authorized tools. Include destination, serial settings where relevant, function code, start address, quantity, timeout and retry policy. Record the software version or configuration revision if it affects decoding. Avoid exporting credentials into the evidence package; redact or exclude secrets using an approved process.
Preserve the distinction between displayed register numbers and protocol offsets. An application may label a holding register with a human-oriented number while transmitting a different offset representation. Save both the configured field and the transmitted request when available. The article on Modbus address offsets treats this interpretation problem separately.
If a change occurred just before the symptom, retain both versions. A record saying “timeout increased” is less useful than a controlled before-and-after configuration export. Do not make several trial changes before saving the initial state: that destroys the ability to connect observations with a specific configuration. Use a small approved test sequence with a rollback plan.
Collect without disturbing the operating bus
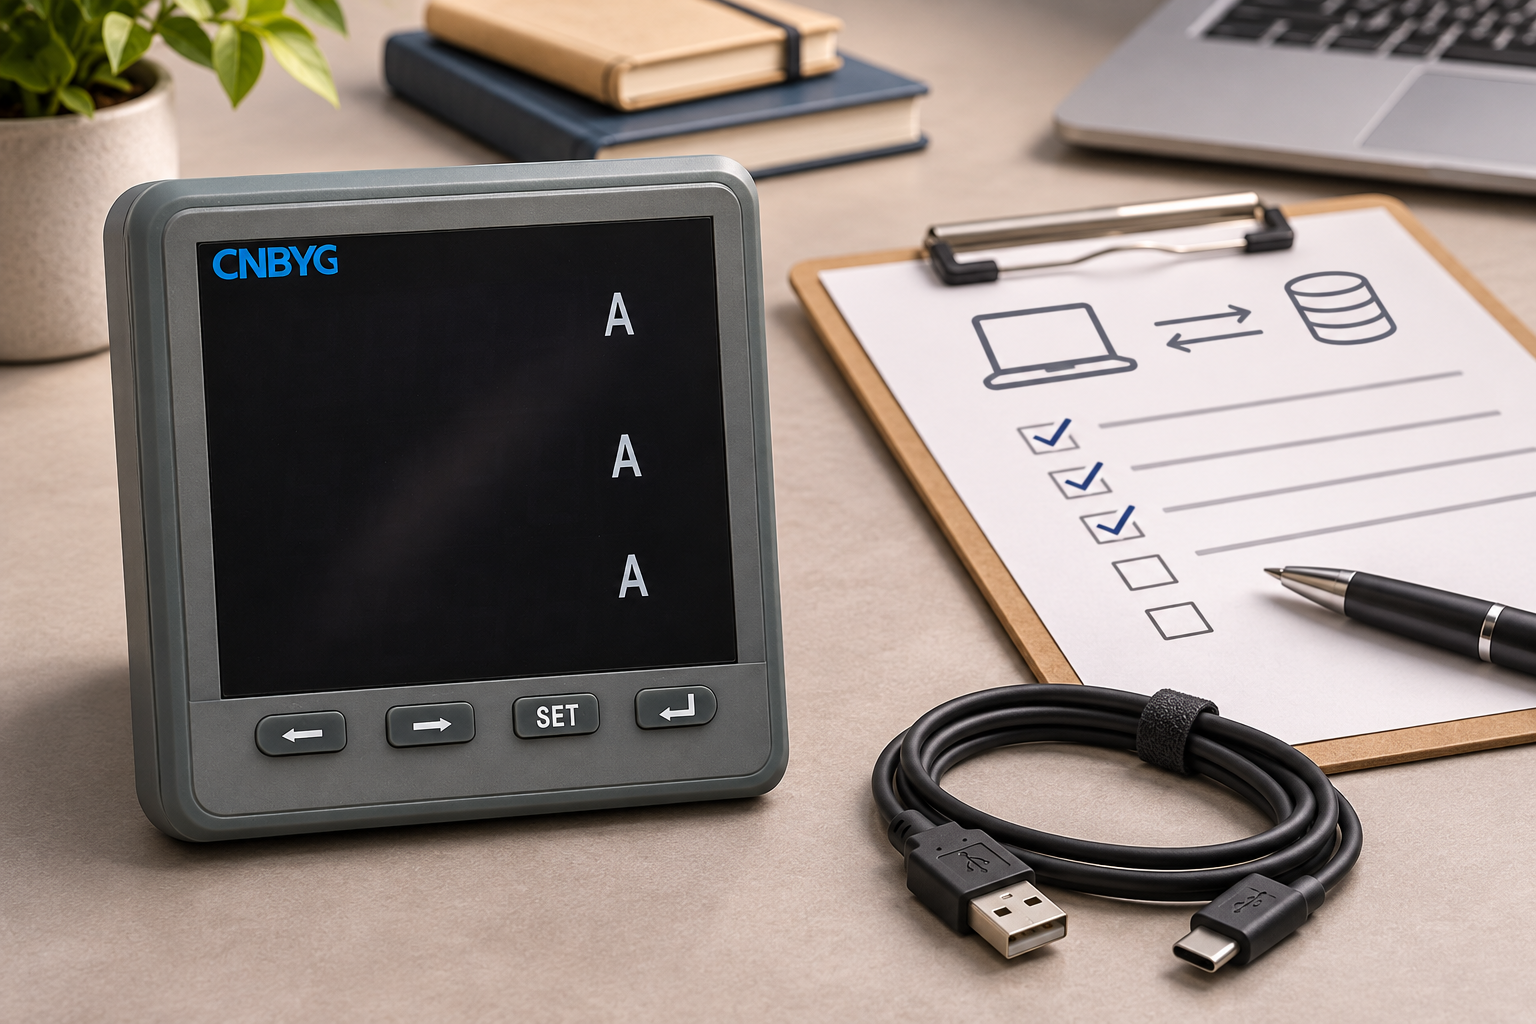
Prefer existing gateway or application diagnostics when they provide sufficient evidence. If a separate tool would initiate requests, verify that it will not become a competing controller on a serial segment. Connecting a laptop and polling alongside an operating controller can create the very faults being investigated. A monitoring tool is only passive if its actual configuration and connection method make it passive.
Set a bounded collection period and a storage location with appropriate access. Include normal exchanges before and after a failure when practical. Stop according to the agreed limit rather than leaving indefinite collection running on production equipment. Note any loss of packets, dropped log entries or sampling limitations reported by the collection tool.
The NIST OT security guide provides a basis for managing operational constraints, monitoring and controlled changes. Diagnostic convenience does not override availability requirements. Work with the system owner when a capture needs a mirror port, physical access or a change to logging verbosity.
Classify what the exchange actually shows
A timeout means that the expected response was not accepted within the defined window at the observed layer. It does not by itself prove a defective meter. Possible boundaries include a wrong route, unavailable device, serial contention, gateway behavior or an application timeout shorter than the actual transaction path. The capture should narrow these possibilities rather than label all of them “no communication.”
An exception response is different: a device or intermediary returned a protocol-defined exception. Save the original function and exception code, then interpret them against the protocol and installed device documentation. The article on Modbus exception codes explains why an exception is evidence of a particular exchange outcome, not a generic permission to try arbitrary writes.
A valid response with an implausible value requires a decoding review. Retain raw register values and the application’s data-type interpretation. Compare units, scaling, word order and measurement scope. Do not edit the log to show only the corrected value. Keep the original evidence, the proposed interpretation and the acceptance observation together so another reviewer can repeat the reasoning.
Prepare a package another engineer can use
Create a short index linking the symptom statement, route diagram, configuration revision, raw capture and decoded examples. Provide a small number of annotated exchanges rather than hundreds of unexplained screenshots. For each example, state the expected request, observed outcome and unresolved question. Include a normal exchange for comparison when one is available.
Keep original files unchanged and create working copies for annotation. A file hash can help detect later changes to the saved package, but it does not prove the measurement was correct or that collection was complete. Record who collected the evidence, when it was exported and which system supplied it. Apply the site’s retention and access policy.
Request exact product support information
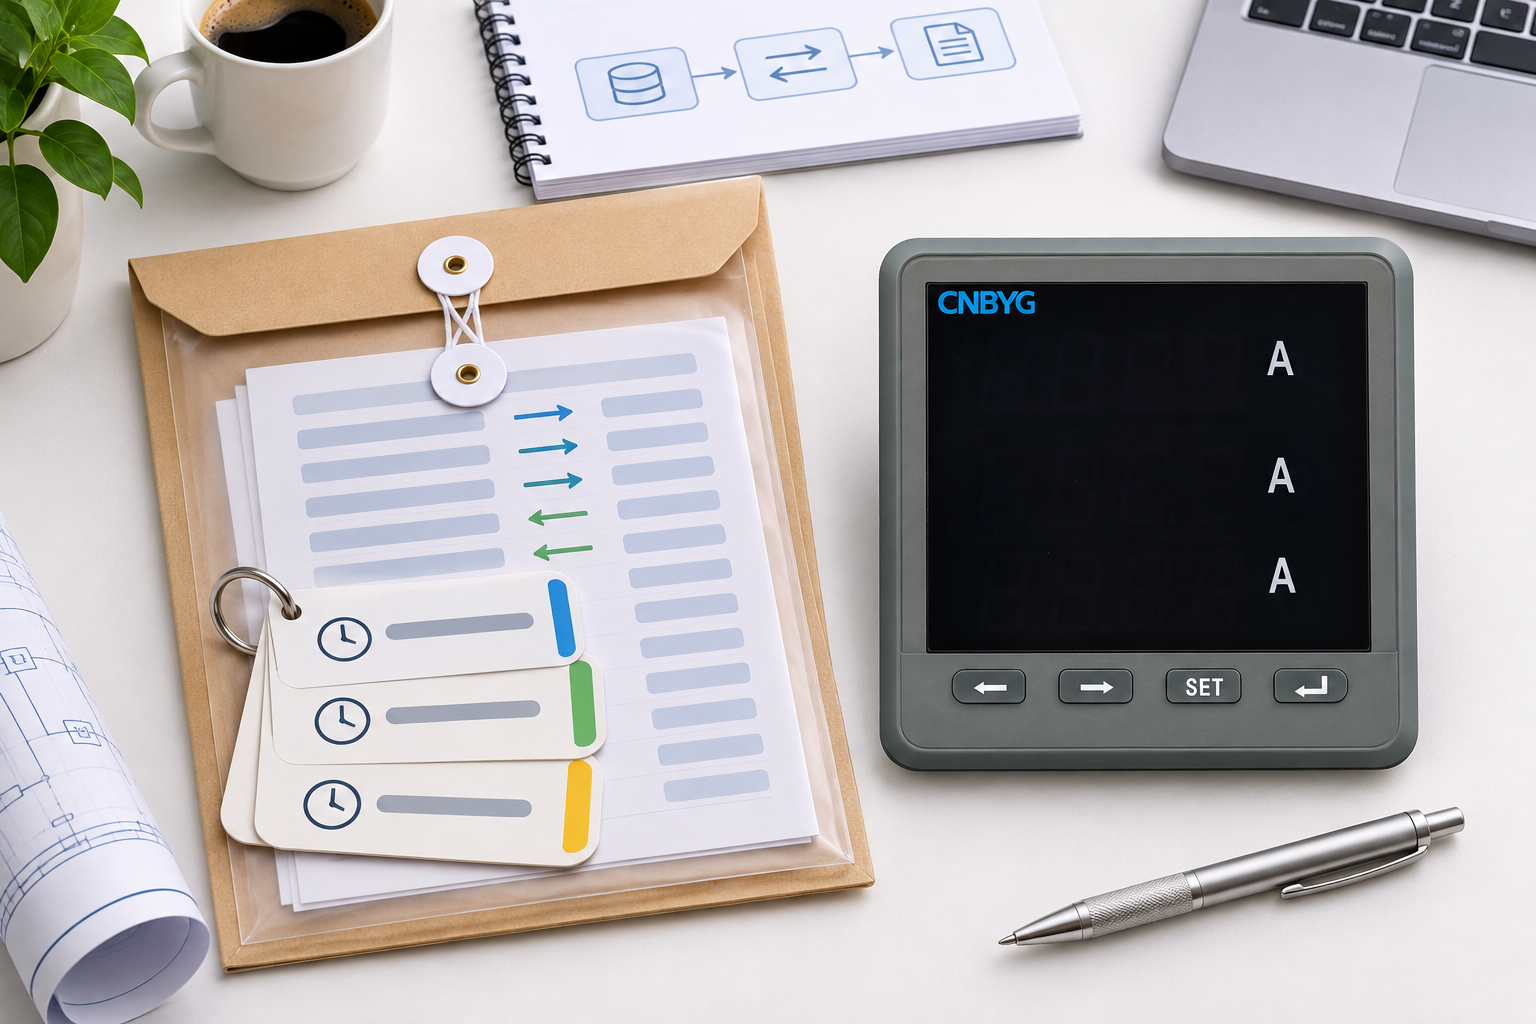
When investigating an installation from the BY194 multifunctional power instrument family, provide the exact model, fitted communications option and relevant manual revision. Do not infer a diagnostic logging function, supported register or firmware identification command from a product-family photograph. Gateway logging and packet capture may be external capabilities.
Include the bounded evidence package, the last known working configuration and the operational constraint on further testing. For the general connection workflow, consult power meter Modbus communication setup. A precise support request helps separate product questions from route, software and interpretation issues without claiming that every symptom has the same cause.
Check the handover package on a separate approved workstation before sending it for review. Confirm that file formats open, timestamps remain readable and redactions have not removed the route information needed to interpret the exchange. Keep sensitive connection details within the authorized support channel.
Educational background
The following neutral lesson explains endianness. It supports the decoding part of a diagnostic review; it is not a Modbus implementation manual or a BY194 register reference.

Frequently asked questions
Is a timeout proof that the meter is faulty?
No. A timeout describes the absence of an accepted response within a defined observation window. Investigate the route, settings, gateway behavior and collection boundary before attributing the cause to hardware.
Can I connect a second polling laptop to a live serial bus?
Do not assume that is safe or supported. A second active initiator can interfere with the operating controller. Use authorized passive diagnostics or an approved isolated test arrangement.
Is a decoded application log enough for every problem?
No. It may omit raw bytes, timing or downstream exchanges. Choose evidence according to the question and state the limitations of the observation point.
Does a capture file hash prove that its readings are correct?
No. A hash can help establish that a saved file has not changed. It does not validate the original measurement, register interpretation or completeness of collection.