Three-Phase Meter Total Power: Verify Phase and Aggregate Point Mapping
Three phase meter total power should be compared with phase readings only after confirming that the points describe the same physical quantity, electrical boundary, sign convention, scale and measurement period. For a correctly defined three-phase four-wire active-power measurement, total active power is the algebraic sum of the corresponding phase active powers. A mismatch in a supervisory display can come from point mapping, stale values or different averaging windows, so it is not immediate proof of a faulty meter. Verify the data definitions and timing before considering changes to the electrical installation.
This guide covers an engineering comparison method. It does not provide undocumented BY194 register addresses, a guaranteed set of phase channels, a numerical acceptance tolerance or instructions for energized testing. Obtain the exact model and measurement configuration first.
Establish which electrical quantity is being compared
Active power, reactive power, apparent power and energy are different quantities. A total active-power point in kW cannot be checked by adding phase currents in amperes, phase apparent powers in kVA or cumulative phase energies in kWh. Similar labels on a dashboard do not make these interchangeable. Write the quantity and unit beside every point before calculating anything.
For a compatible three-phase four-wire measurement, the basic active-power relationship is Ptotal = P1 + P2 + P3, with all four values expressed in the same unit and referenced to the same boundary and period. The addition is algebraic: preserve negative values according to the documented direction convention. Do not take absolute values simply to make the result agree with an import-only expectation.
The IIT Roorkee Virtual Labs explanation of three-phase power measurement derives total power from the relevant measured contributions and explains the two-wattmeter arrangement. Its derivation helps distinguish an electrical measurement method from a dashboard label. Three-wire measurement arrangements require special care. A meter may use two measuring elements or present calculated phase quantities under a manufacturer-defined convention. The labels alone do not prove that three displayed phase values are independent quantities suitable for the same check. Use the exact wiring-mode description and register definitions rather than extending a four-wire example to every installation.
Assemble a point-definition worksheet
For each selected measurement, record physical meter identity, documented address or point identifier, function or data source, data type, width, ordering, scale, unit, sign and quality. Add whether the value is raw, transformer-scaled, calculated by the meter or calculated by the supervisory application. Keep the original map revision with the worksheet.
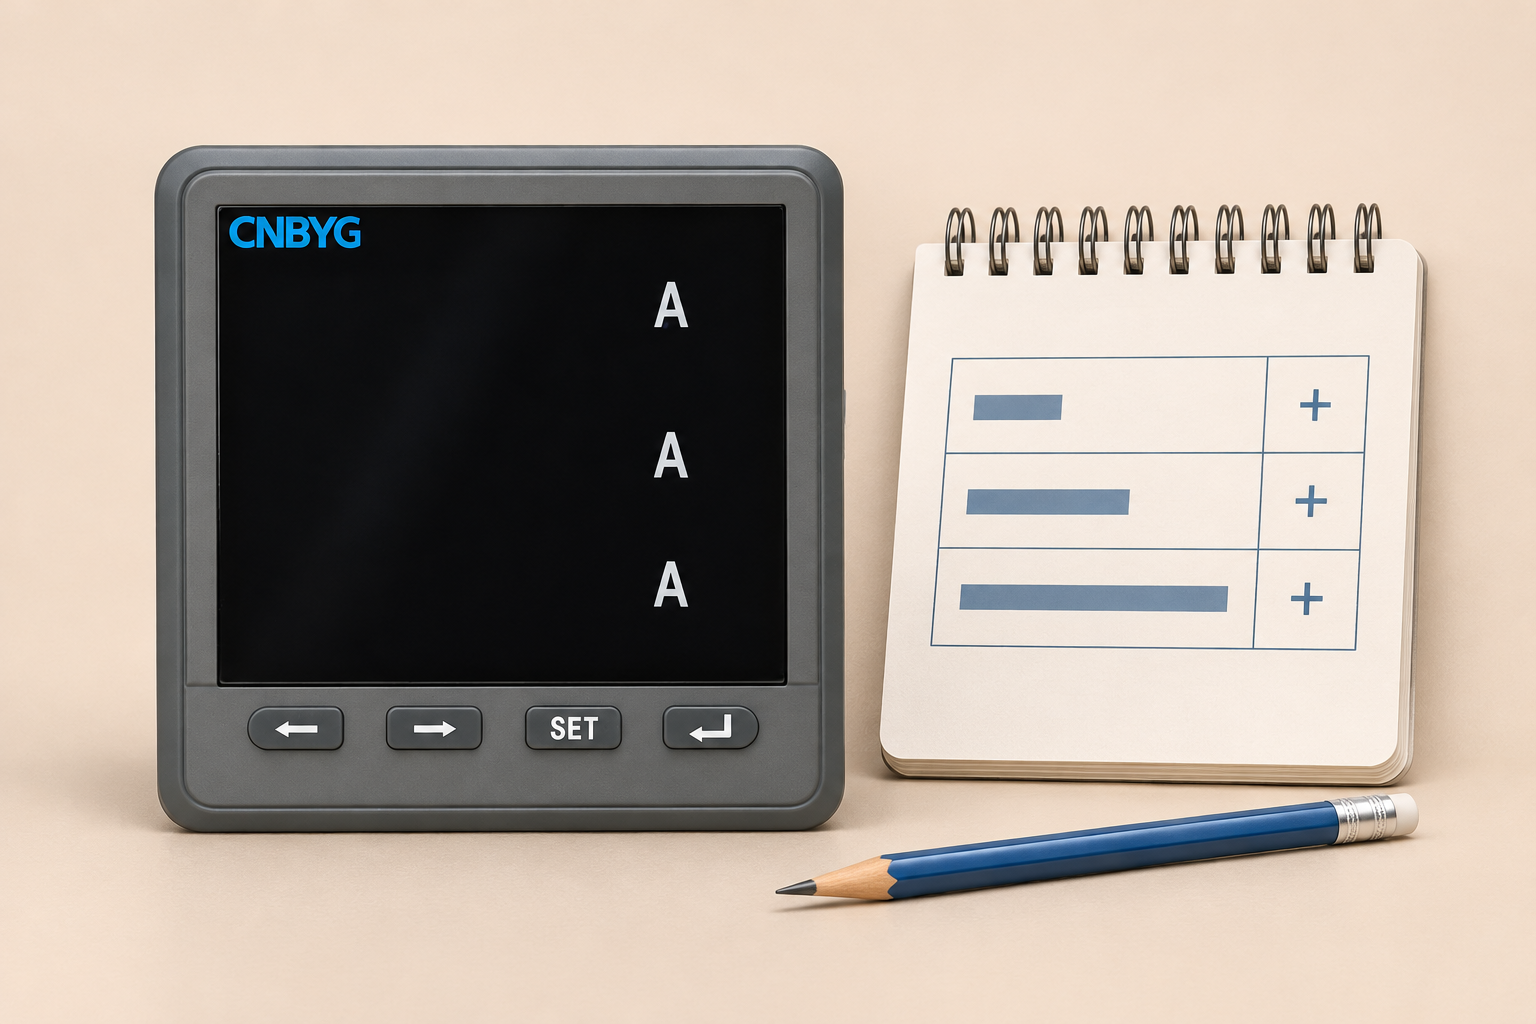
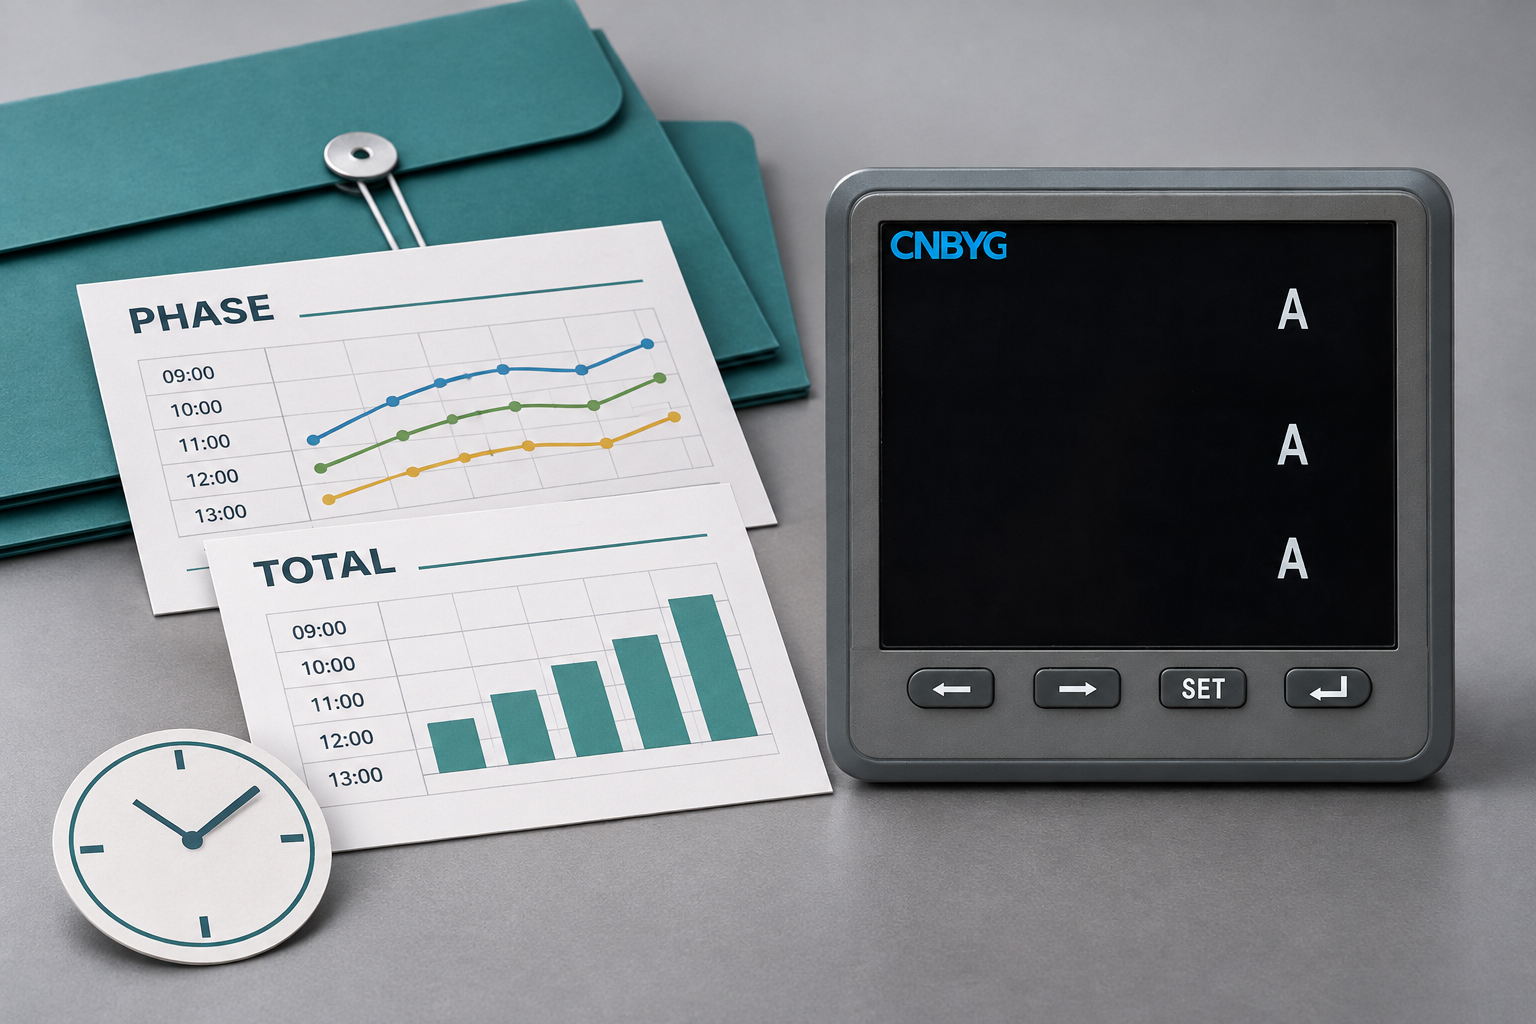
The BY194 instrument family page supplies relevant product context, but cannot establish the register layout or installed functions of every variant. Ask for the exact order code, manual and communication option. A reference photograph showing three current markings does not prove availability of three active-power channels or a total active-power register.
Start with the Modbus communication and decoding workflow if the basic readings have not been accepted. Correct transport is only the first layer. A reply from the intended instrument can still be decoded as the wrong quantity or scaled twice by downstream software.
Match timing before checking the sum
Three phase values read sequentially may represent different operating instants. A rapidly changing machine load can make their sum differ from a total obtained later, even when every address is correct. Identify whether the meter refreshes related quantities coherently, whether the gateway caches them independently and whether the supervisory application assigns measurement or receipt timestamps.
Use a stable operating period for an initial comparison when the site can provide one safely. If the instrument documents a supported coherent snapshot method, follow it. Reading adjacent registers in one request does not itself prove that the underlying measurements were captured simultaneously. Likewise, identical gateway timestamps can describe batch arrival rather than a common electrical instant.
Separate instantaneous, averaged and demand points. A total representing a rolling average will not necessarily equal three instantaneous phase values. The DOE metering guidance provides context for selecting and managing meter information according to its intended use; the actual refresh and aggregation behavior still comes from the selected system’s documentation.
| Worksheet field | Evidence required | Why a mismatch can occur |
|---|---|---|
| Quantity | Active-power definition for every point | Current, apparent power or energy was selected |
| Boundary | Same meter and circuit | Values came from different feeders |
| Unit and scale | Documented W or kW transformation | A factor was omitted or applied twice |
| Direction | Signed import/export convention | A negative phase was converted to magnitude |
| Time basis | Refresh, averaging and timestamp rules | Sequential or cached readings differ |
| Measurement mode | Exact three-wire or four-wire definition | Phase labels were interpreted incorrectly |
The table contains review conditions rather than product defaults. An unresolved field means the numerical comparison is not yet a valid acceptance test.
Calculate a signed example and explain the difference
Consider an illustrative four-wire dataset with phase active powers of 12, 8 and minus 1 kW. The signed sum is 19 kW. If the documented total is 19 kW for the same period, the arithmetic is consistent. Adding magnitudes instead produces 21 kW and removes the directional information carried by the third phase.
Define the absolute difference as D = Ptotal - (P1 + P2 + P3). If the total is 19.2 kW for the example, D is 0.2 kW. A relative comparison can be written as 100 × |D| / |Ptotal| when the total is meaningfully away from zero. This gives approximately 1.04 percent for the illustrative values. It is a calculation, not a recommended acceptance limit or evidence of meter accuracy.
Near zero total power, the relative result becomes unstable and can exaggerate a small absolute difference. Record the absolute difference and operating condition instead of declaring failure from a large percentage alone. Establish project acceptance criteria from instrument specifications, resolution, timing, transformation and the measurement purpose; do not invent a universal percentage tolerance.
Check decoding and engineering units in order
Compare the raw response with the approved map, then decode it using the specified type and byte or word order. Verify the correct address convention and register width. A plausible-looking number is weak evidence because the wrong data type or nearby quantity can occasionally produce a value inside an expected range.
Next, apply the documented scale and unit transformation once. A phase point expressed in W and a total expressed in kW require explicit conversion before addition. NIST’s quantity and unit guidance supports keeping the numerical value and unit together. Preserve both source and destination units in the mapping record so that later reviewers can reconstruct the calculation.
Check whether CT and voltage-transformer ratios are already incorporated by the instrument or another layer. A downstream ratio applied to phase points but not the total can create a systematic discrepancy. Consult the separate meter unit normalization procedure when the issue is the transformation rule rather than the physical measurement.
Preserve quality and distinguish stale values
A comparison is meaningful only when all required inputs have acceptable quality under the site’s policy. An invalid phase point must not become zero merely because the reporting calculation needs a number. A held last-good phase value should remain visibly stale if the current total continues to update. Record both quality and age with the selected sample.
The relevant meter quality flag mapping guide addresses how external systems represent valid, invalid and uncertain evidence. The existence of a platform quality flag does not establish a corresponding register on every meter. If the gateway creates the flag, document that origin instead of attributing it to the instrument.
Use a bounded capture containing the raw values, decoded quantities, timestamps, quality, configuration revision and operating notes. Repeating that capture after one controlled change makes the investigation testable. Changing several addresses, scaling factors and sign rules together may produce agreement without identifying the actual error.
Escalate electrical questions through the approved procedure
If mapping, timing and quality checks pass but the discrepancy remains, ask qualified personnel to review the installation and documented measurement configuration. Phase association, sensor polarity and wiring mode can affect reported power. Software arithmetic alone cannot determine which conductor or sensor should be moved, and an online article cannot authorize live electrical work.
Provide the one-line diagram, exact meter model, approved connection drawing, CT and voltage ratios, operating condition and captured dataset. Describe observed facts rather than a guessed corrective action. Do not swap inputs, reverse CT secondaries or open an energized measurement circuit to test a theory from dashboard values.
For purchase or integration acceptance, request a defined point list and a demonstration under agreed conditions. Specify which totals and phase quantities are required, how they are timestamped, how quality is reported and where scaling occurs. This prevents a family name or front-panel layout from becoming an unsupported assumption about the delivered configuration.
Further learning: power and energy
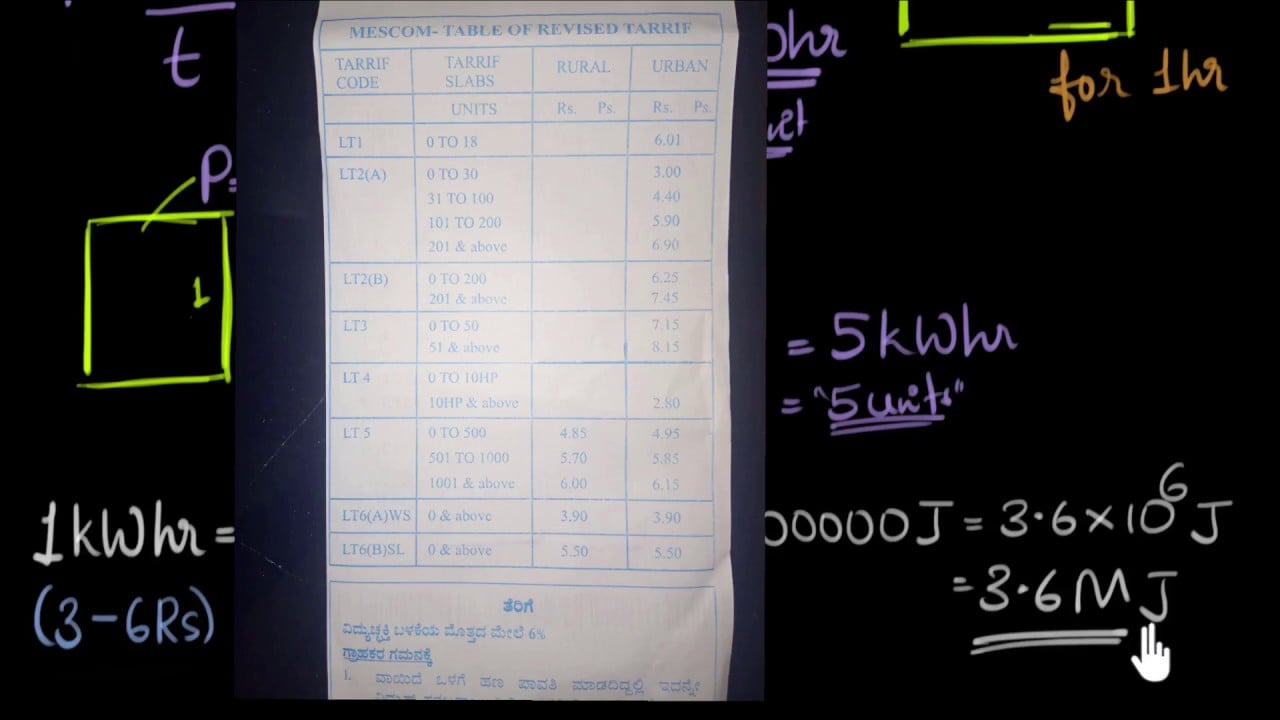
The following Khan Academy lesson explains the relationship between energy and power. It supports the first step of this review: distinguishing a rate in power units from an accumulated energy quantity. It is an educational foundation, not a three-phase wiring lesson, a register map or a product performance demonstration.
Frequently asked questions
Should total kW always equal the three displayed phase numbers?
Only when those numbers are corresponding active-power measurements with compatible boundary, units, signs, timing and measurement mode. A three-wire arrangement or a differently averaged total requires its own documented interpretation.
Can I add phase current to verify total active power?
No. Current and active power have different meanings and units. Use documented active-power points for the algebraic sum, or follow the correct electrical calculation with all required voltage, current and phase information.
What percentage difference proves a meter is defective?
There is no universal percentage for this comparison. Evaluate specifications, resolution, timing, configuration and operating conditions. A relative difference near zero total power can be misleading even when the absolute discrepancy is small.
Does the BY194 reference image prove phase power registers exist?
No. A front view confirms visible appearance only. Obtain the exact model’s function list, measurement mode and communication map before assuming the required phase and total points are available.